Advanced Metrics
With the newest additions to Custom Metrics, you can now create more powerful expressions by combining aggregations with schema fields using operators. This allows you to implement specific business metrics, which can be used in policies and signals to control traffic with more precision.
Key Features of Advanced Metrics
With these Advanced Metrics, you can create:
- Ratio Metrics
- Time difference between events (to detect rapid actions)
- Threshold calculations (to set policy limits)
These metrics are made possible through the introduction of new operators and fields:
- Constants: Add any constant numerical value to your calculations.
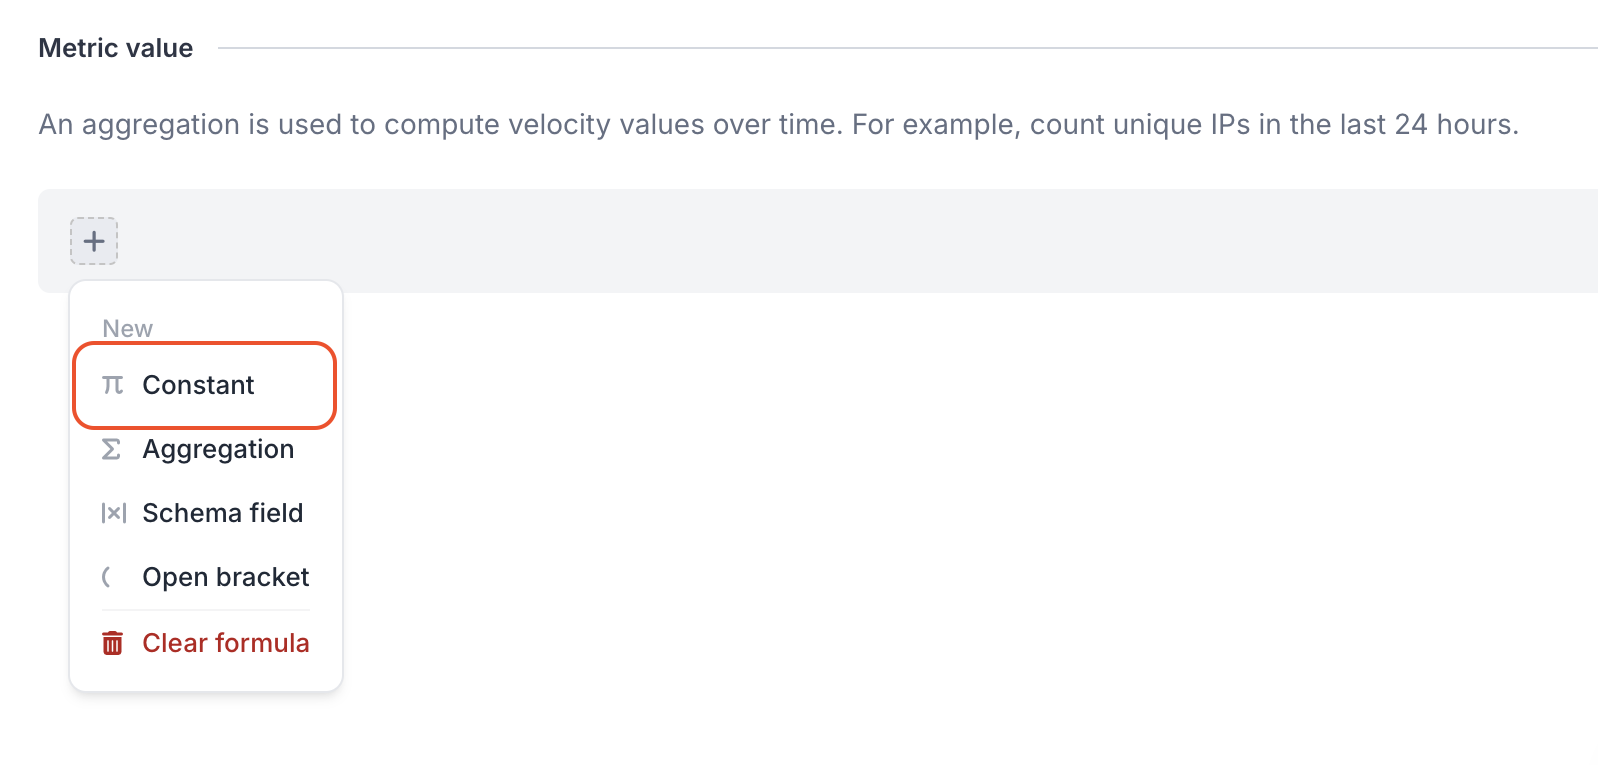
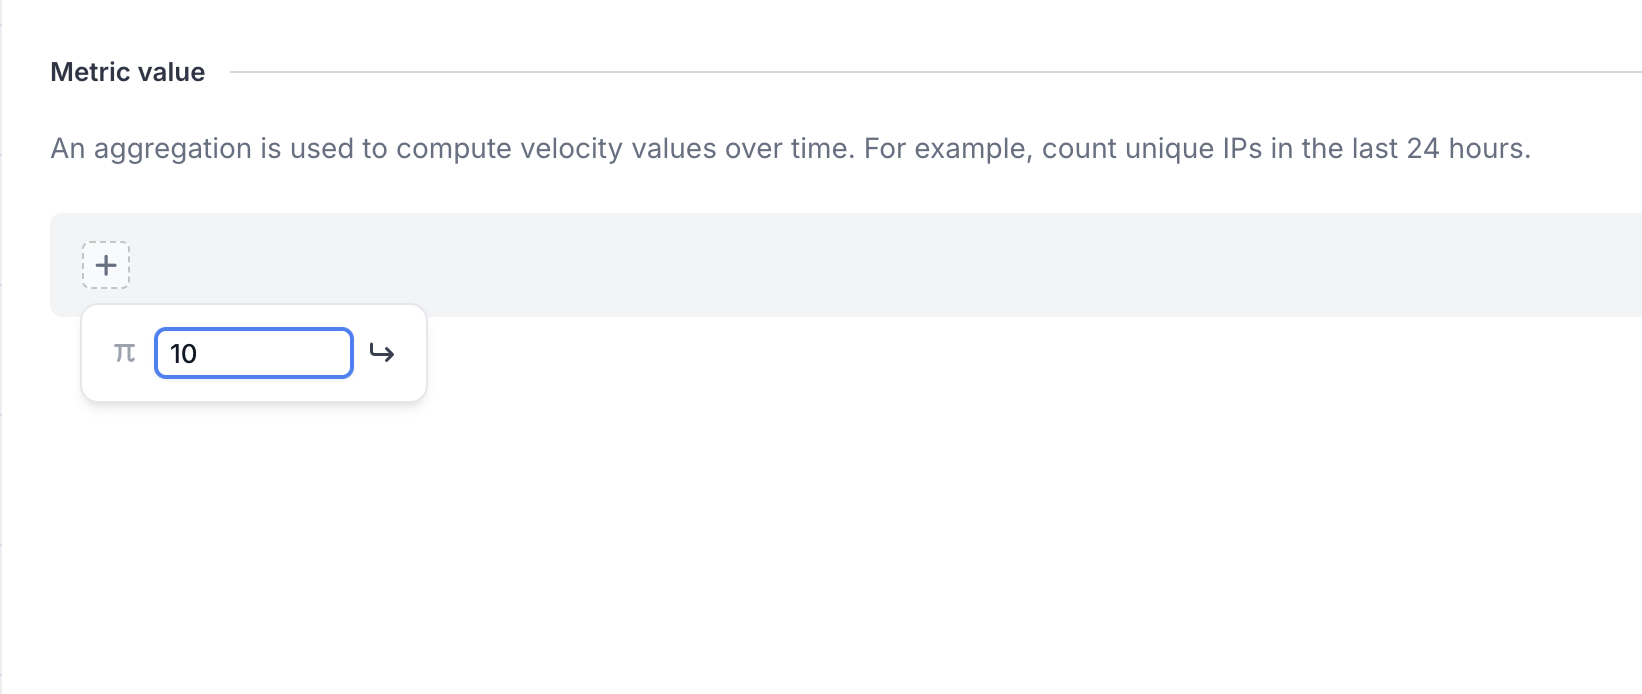
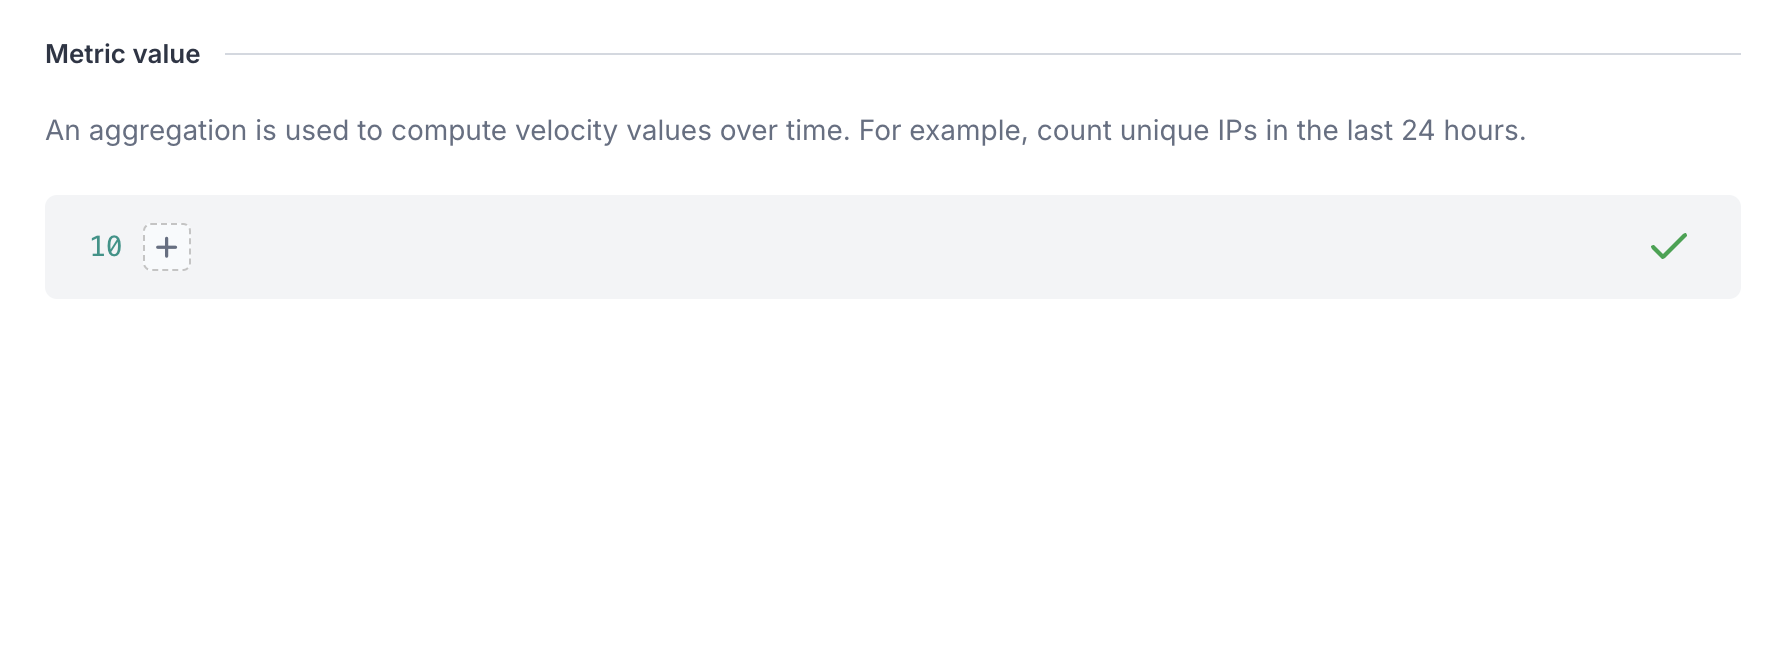
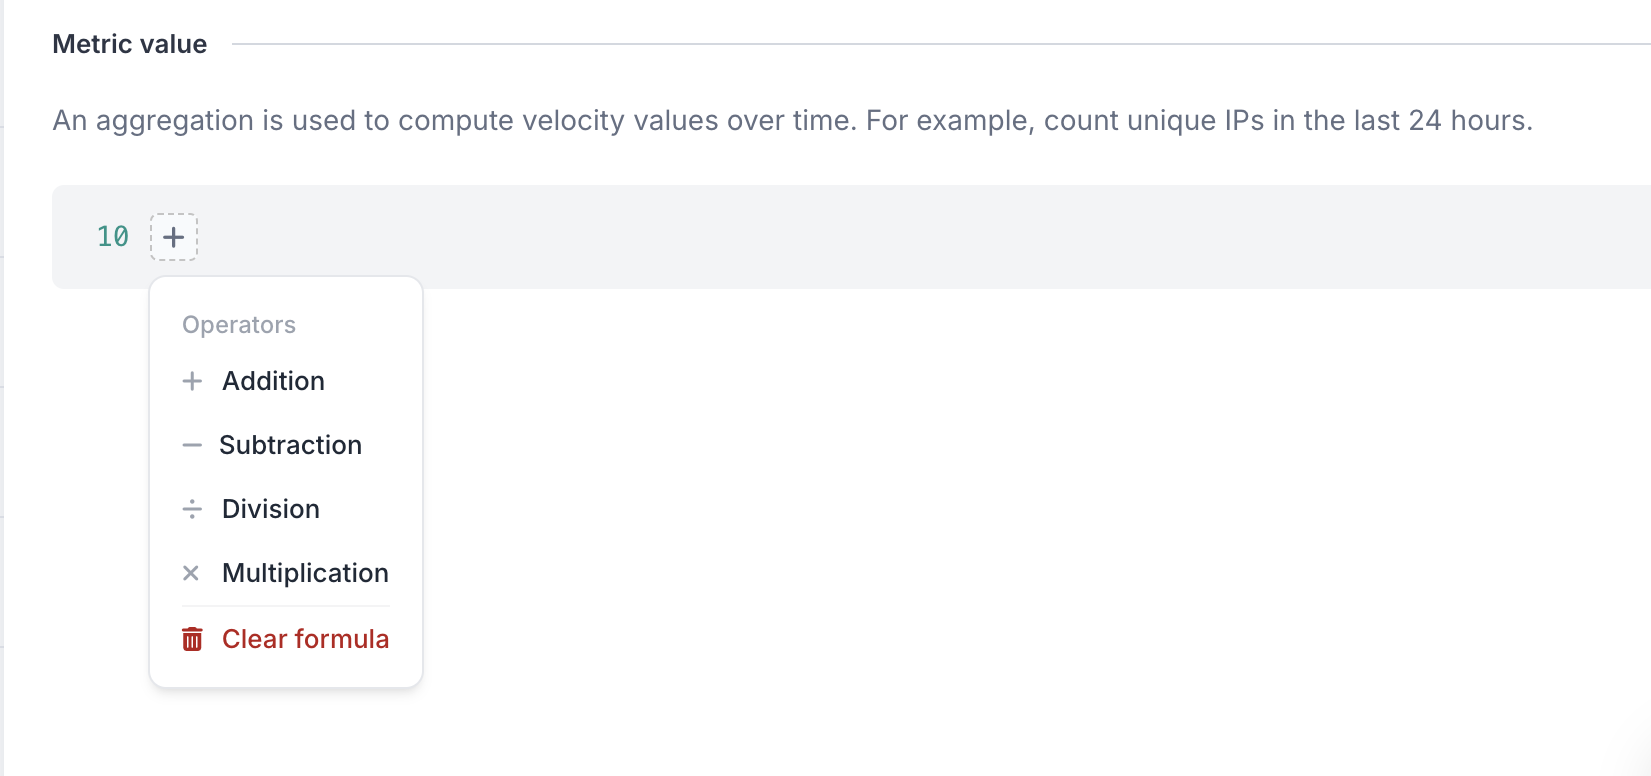
- Operators: Perform calculations using Addition, Subtraction, Division, or Multiplication.
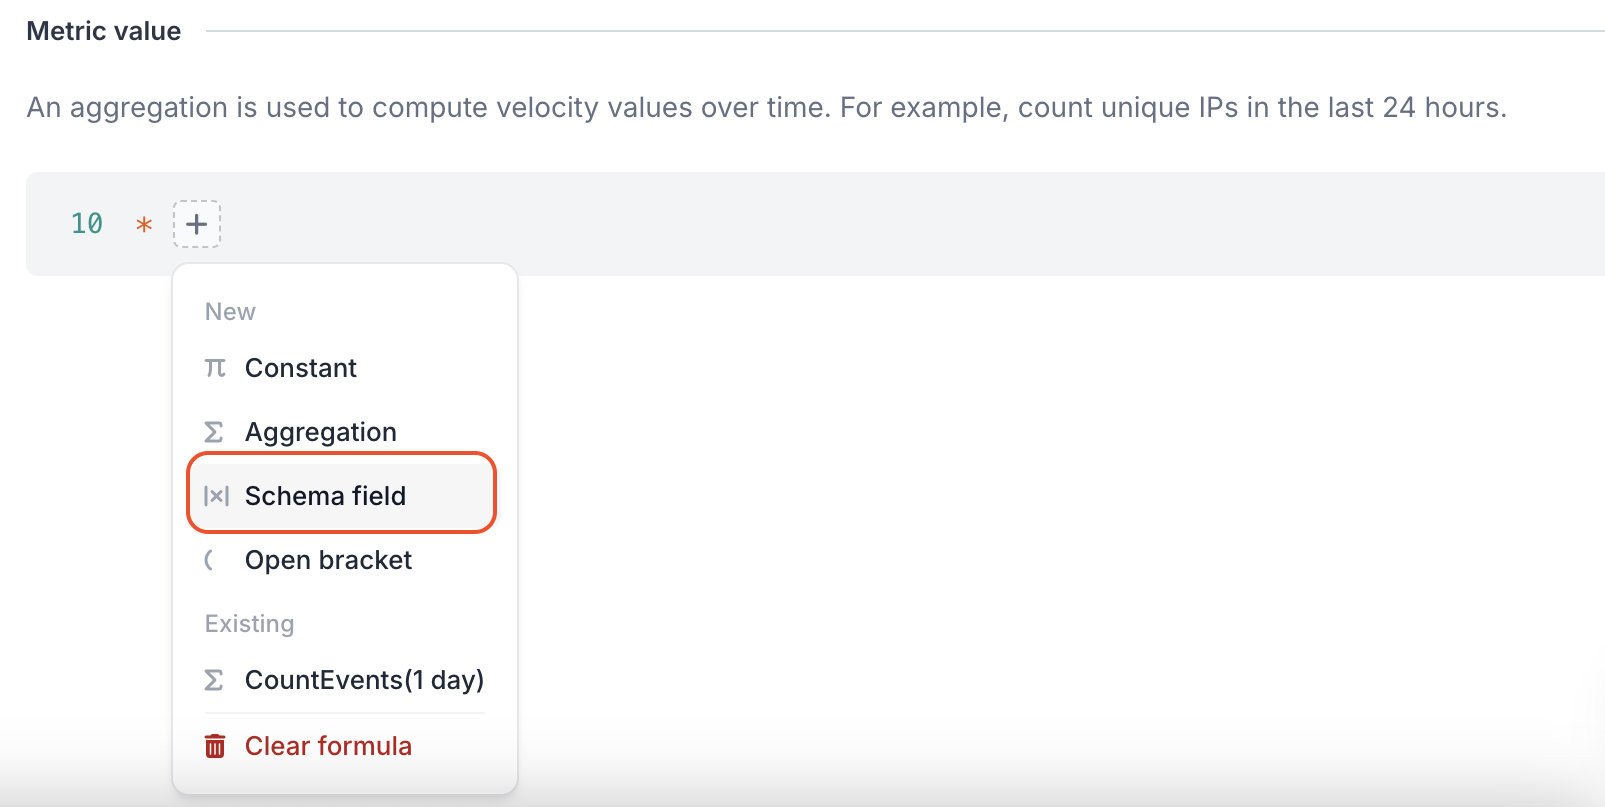
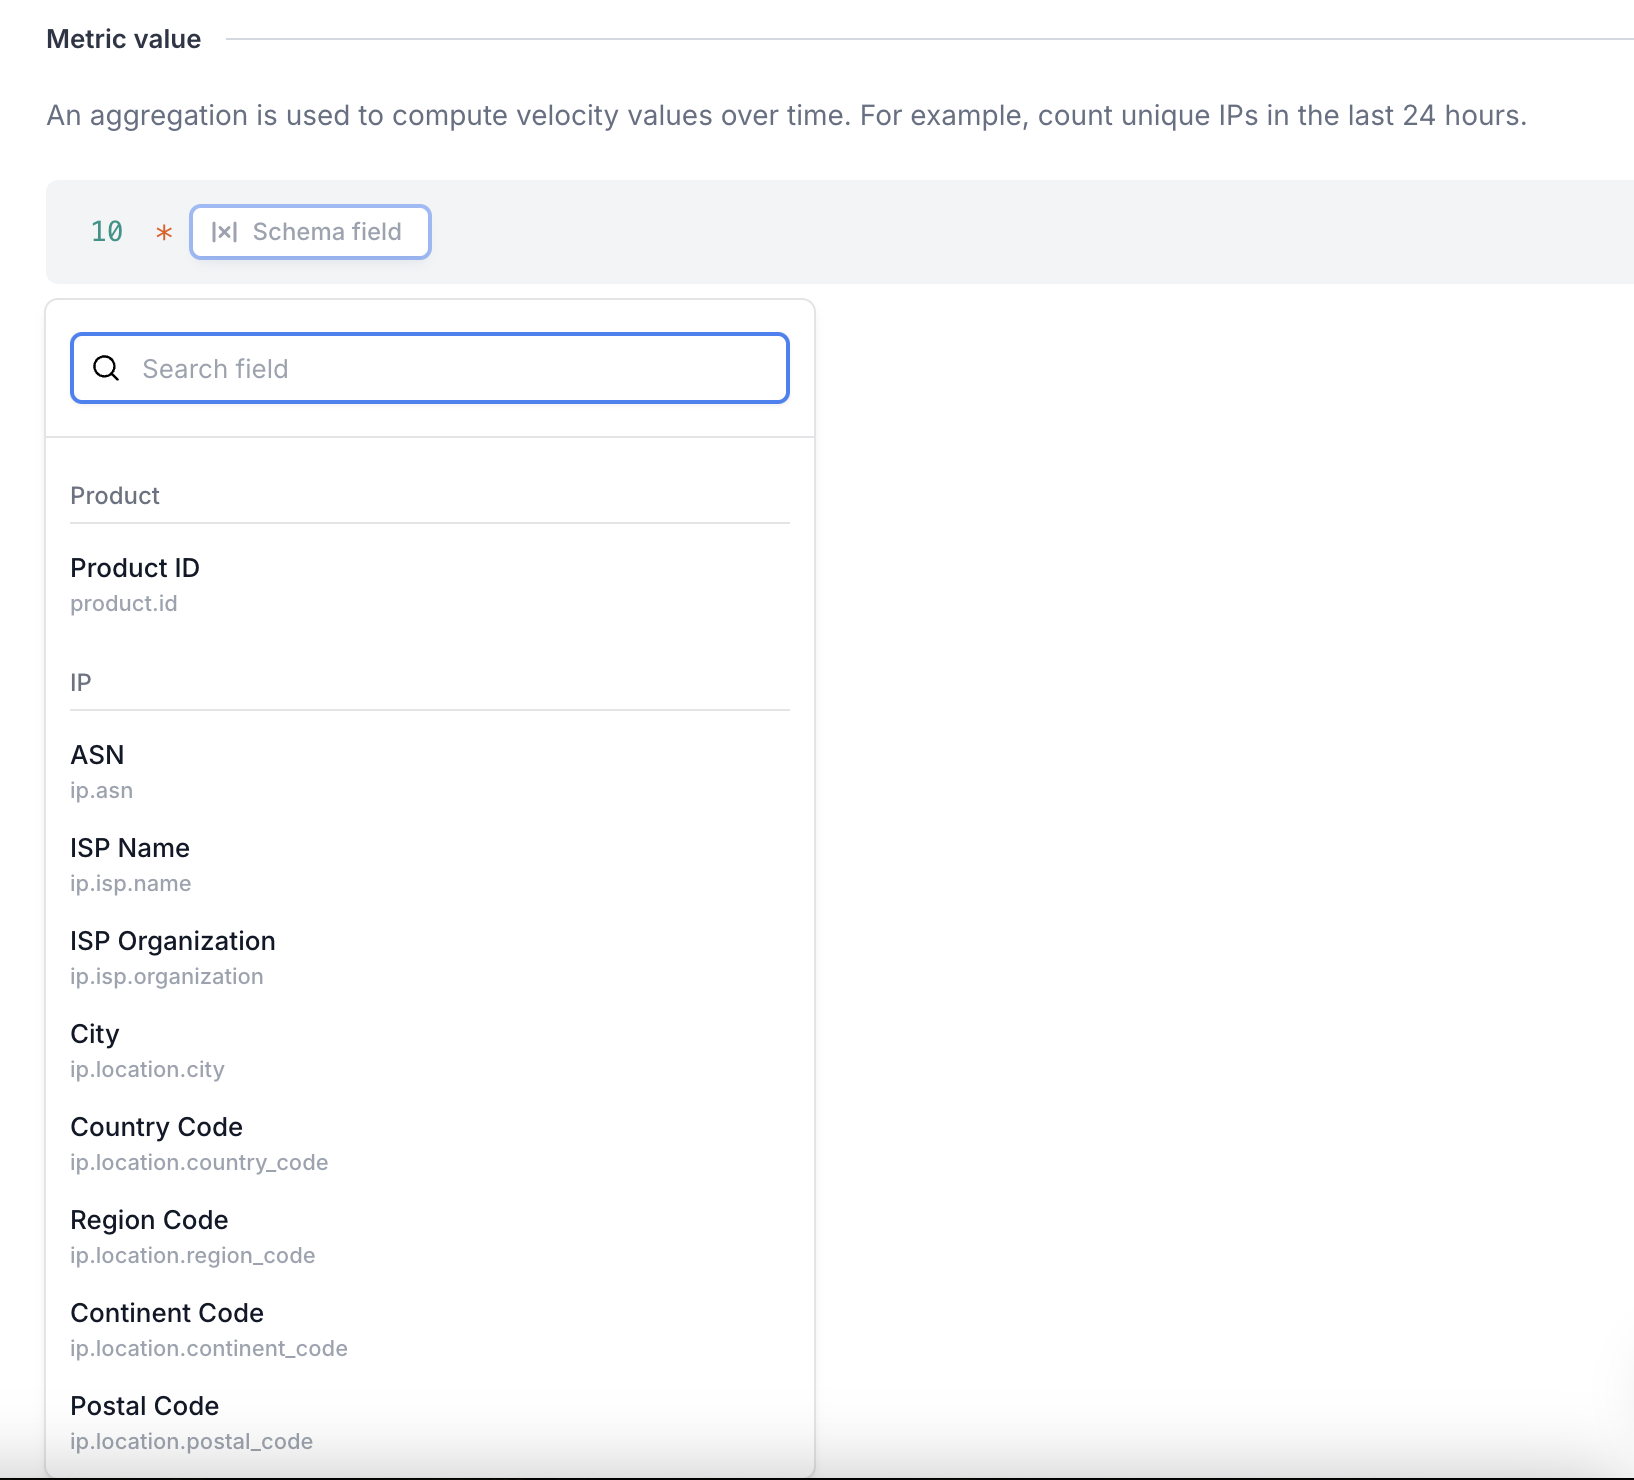
- Schema fields: Incorporate any schema field from the dashboard into your calculation. Make sure to use only schema fields with numerical types to ensure accurate metric calculations.
- Brackets: Use brackets to create nested calculations.
- Aggregations: Combine multiple aggregations into a single metric. Note that at least one aggregation is required for a metric to be saved.

Don't forget to set the "Include current event" toggle appropriately. When enabled, it includes the current event in the calculation..
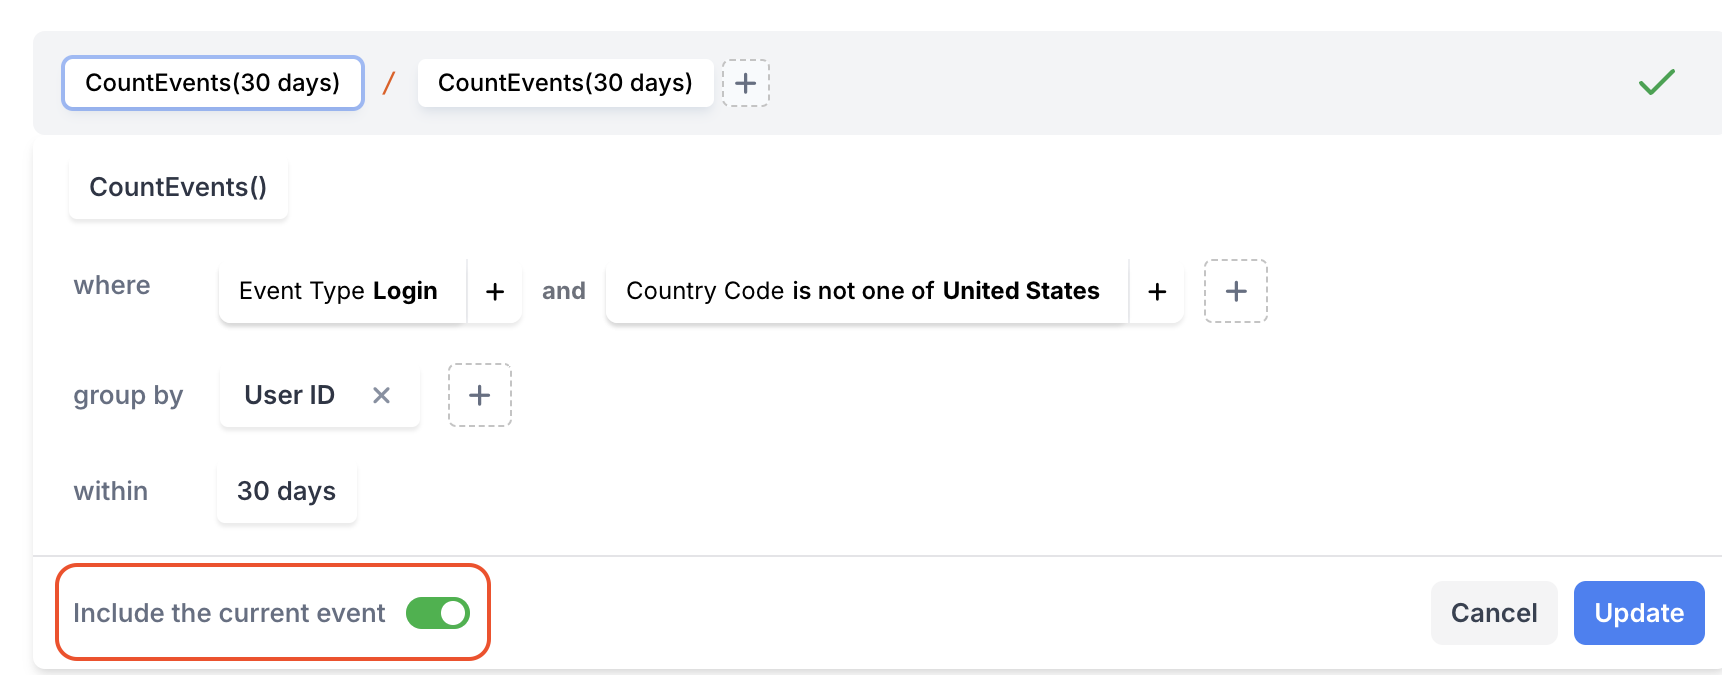
How does the "Include the current event" work?We introduced the "Include the current event" toggle to help you determine if the event you sent should be taken into account when calculating your metric.
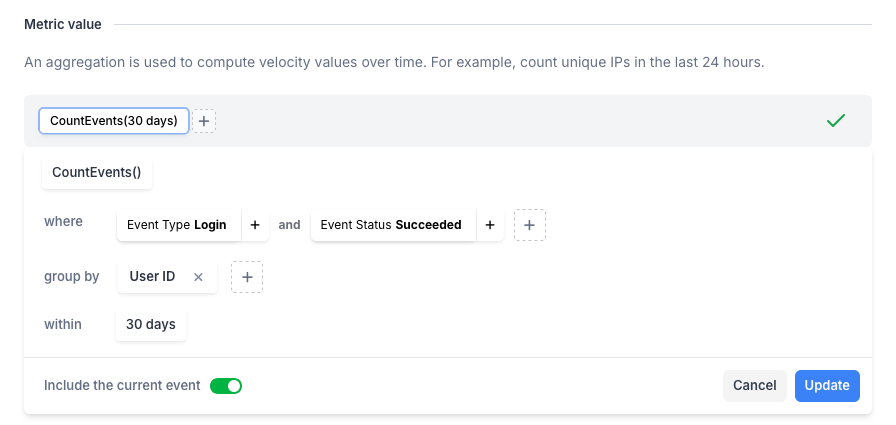
To make it simpler to understand, lets use an example. The metric we'll use is defined as follows:
4 consecutive login succeeded events with "Include the current event" enabled:
- Login from Poland for User 1: metric value 1
- Login from United States for User 1: metric value 2
- Login from Germany for User 1: metric value 3
- Login from United States for User1 : metric value 4
Now the same with "Include the current event" disabled:
- Login from Poland for User 1: metric value Unknown
- Login from United States for User1 : metric value 1
- Login from Germany for User 1: metric value 2
- Login from United States for User1 : metric value 3
Example Calculations
1. Ratio Metrics
Detect anomalies by comparing different types of events. For example, you can calculate the ratio of failed logins to successful logins for a user in one day. A high ratio may suggest suspicious activity. Here's how to set it up:
- Count the number of
$login$failedevents per user per day.
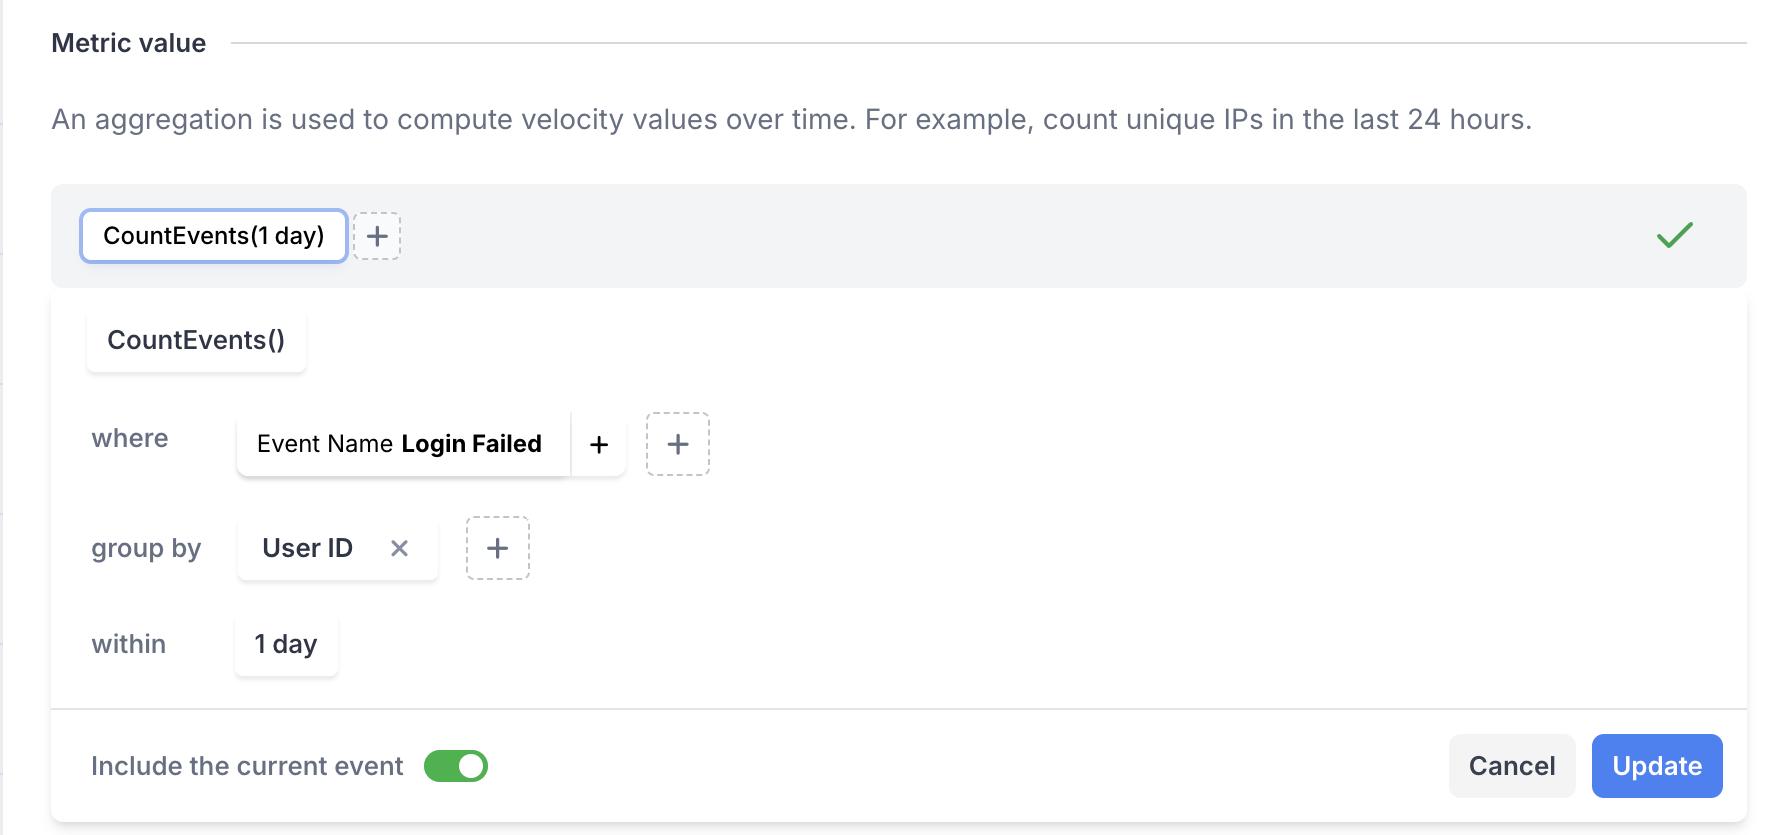
- Add the "Division" operator

- Count the number of
$login$succeededevents for that user.
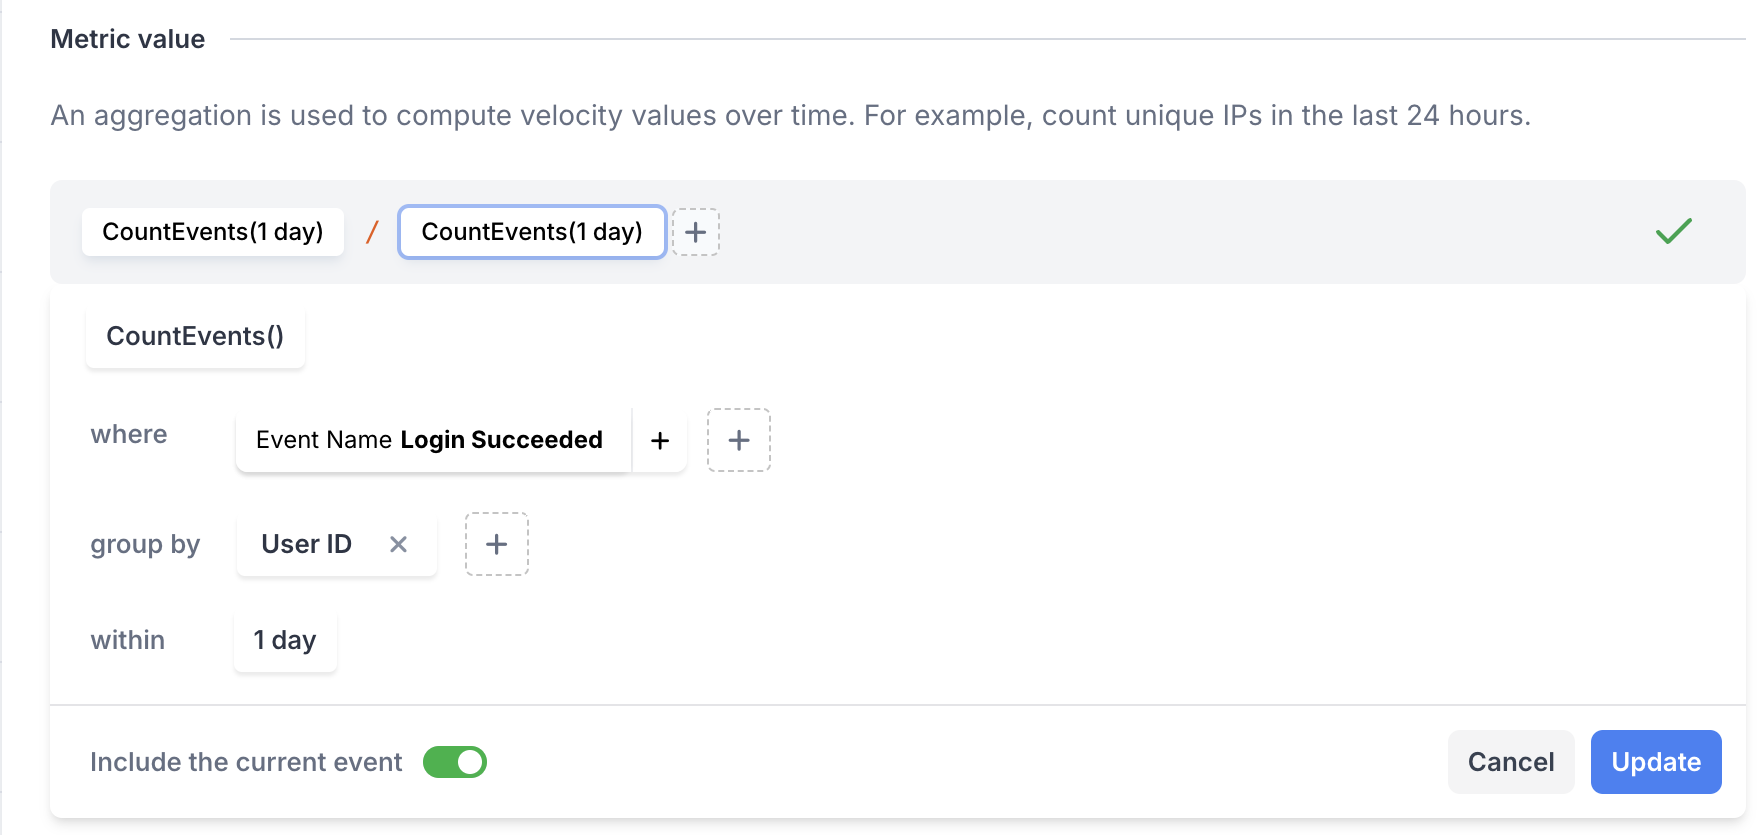
- Save the metric and ensure it's enabled. The ratio will be calculated for each new event.
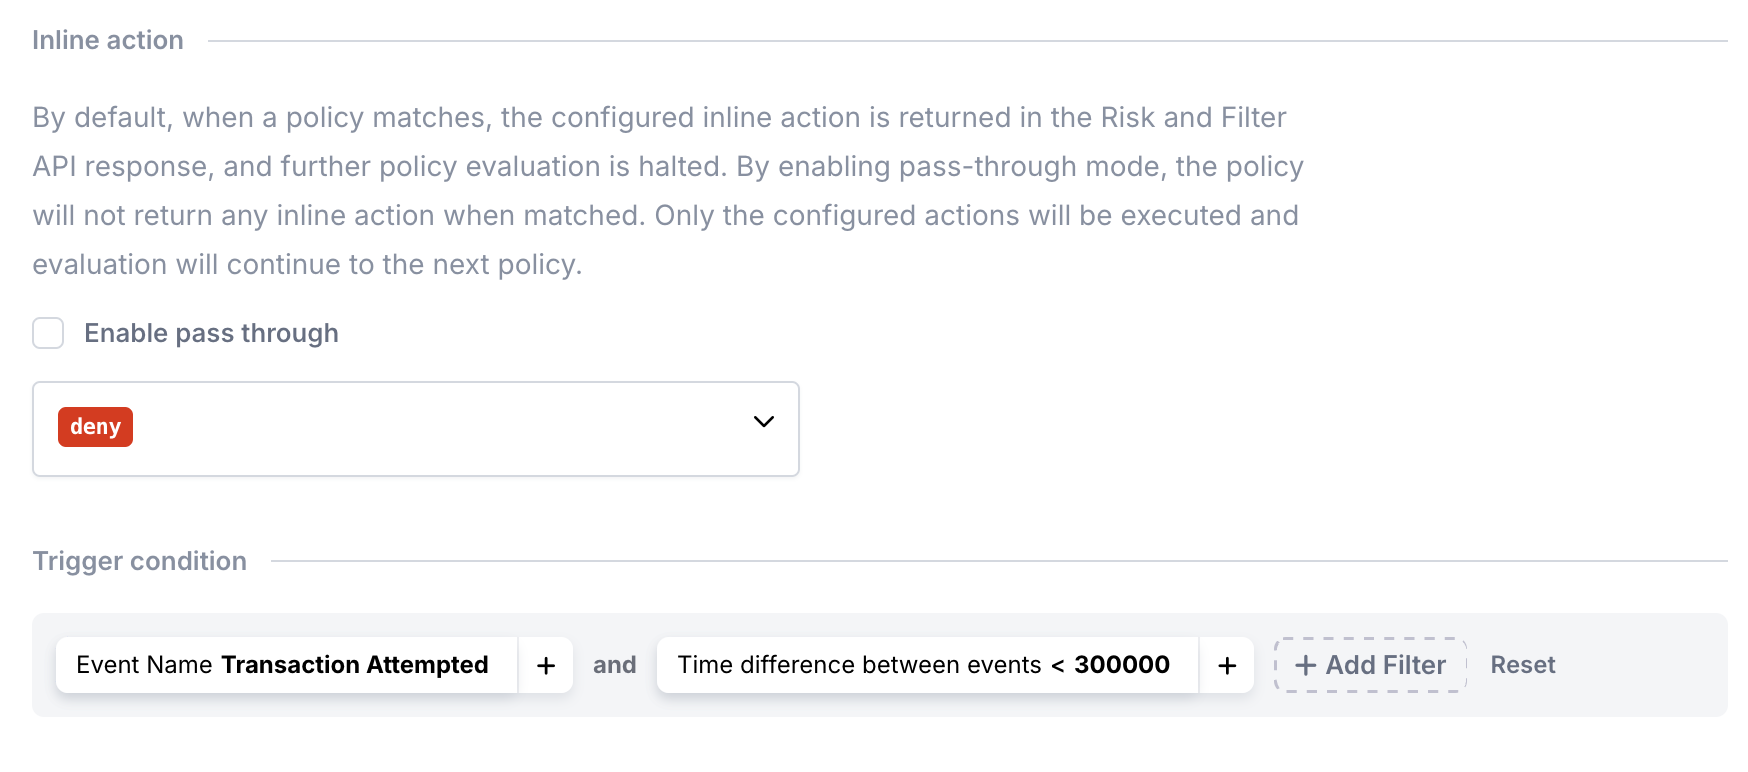
2. Time difference between events
Track the time between events to identify rapid, potentially malicious actions. For instance, calculate the time between the last successful login and a transaction. A short time gap might indicate fraud.
- Add the current event's timestamp as a "Schema Field."
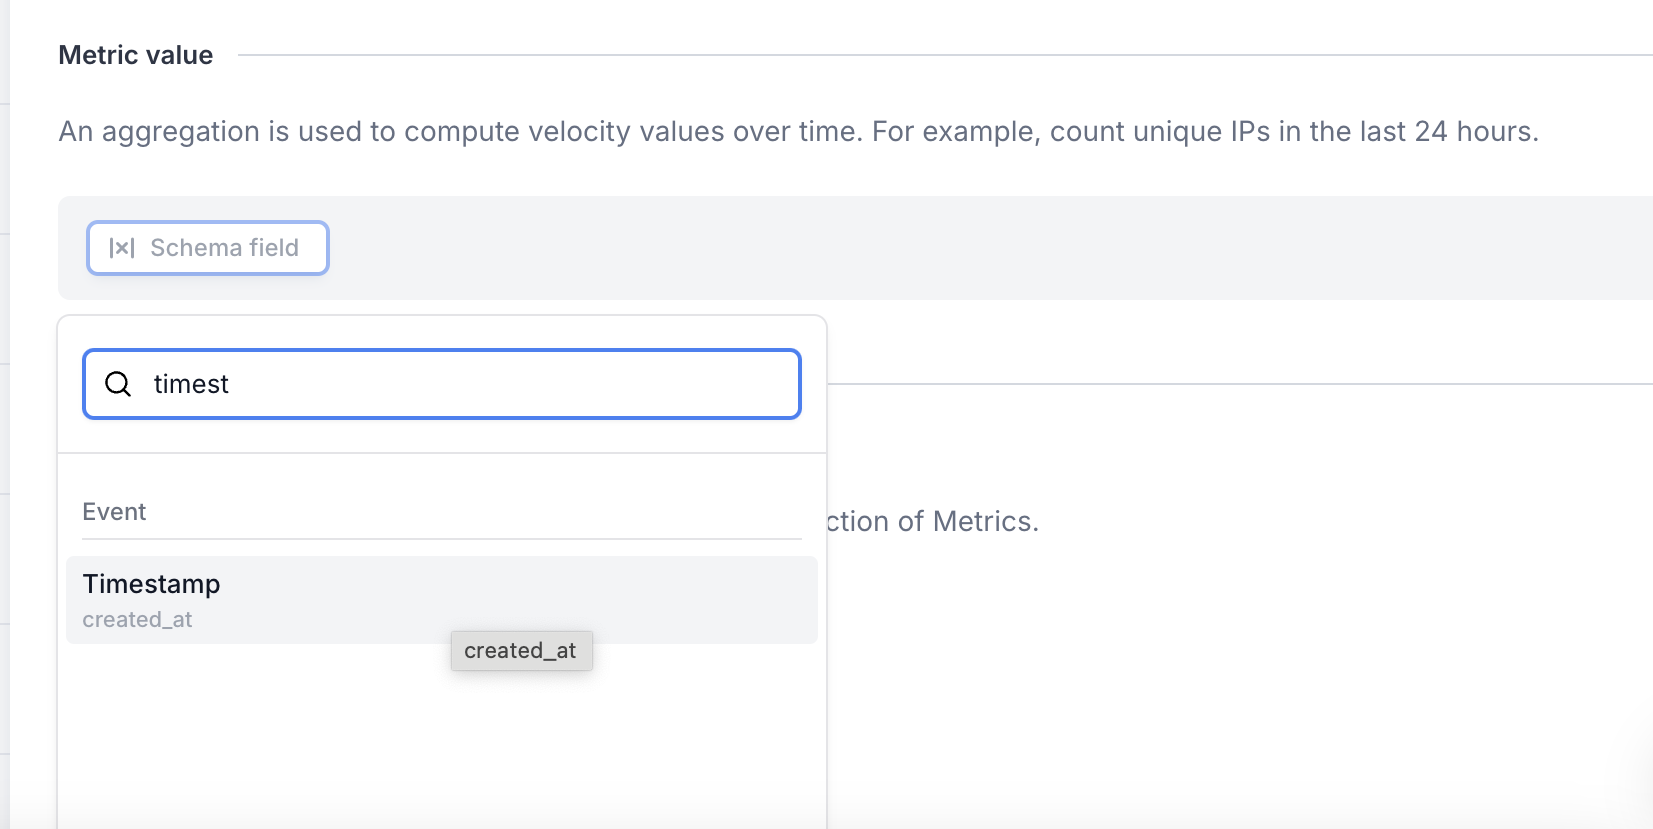
- Add the "Subtraction" operator.

- Get the timestamp of the last
$login$succeededevent.
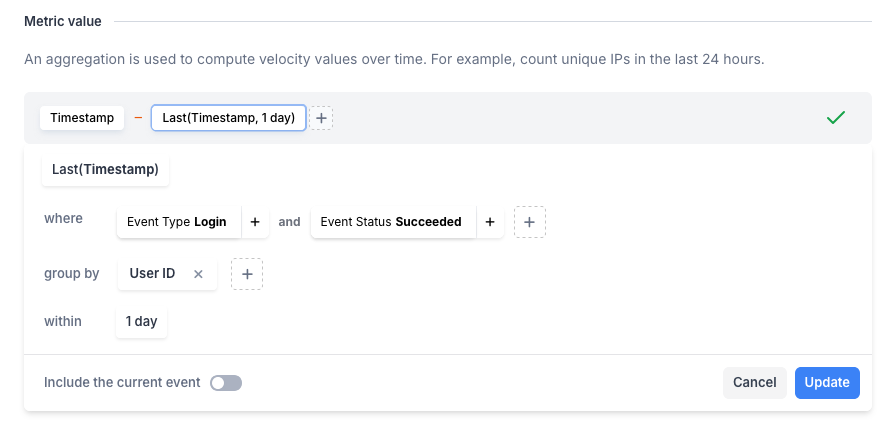
Remember to disable the "Include the current event" toggle.
- Save the metric and make sure it's enabled. You can use this in policies to trigger alerts if the time difference between a login and transaction is too short. The difference is returned in milliseconds.
3. Threshold calculations for policy limits
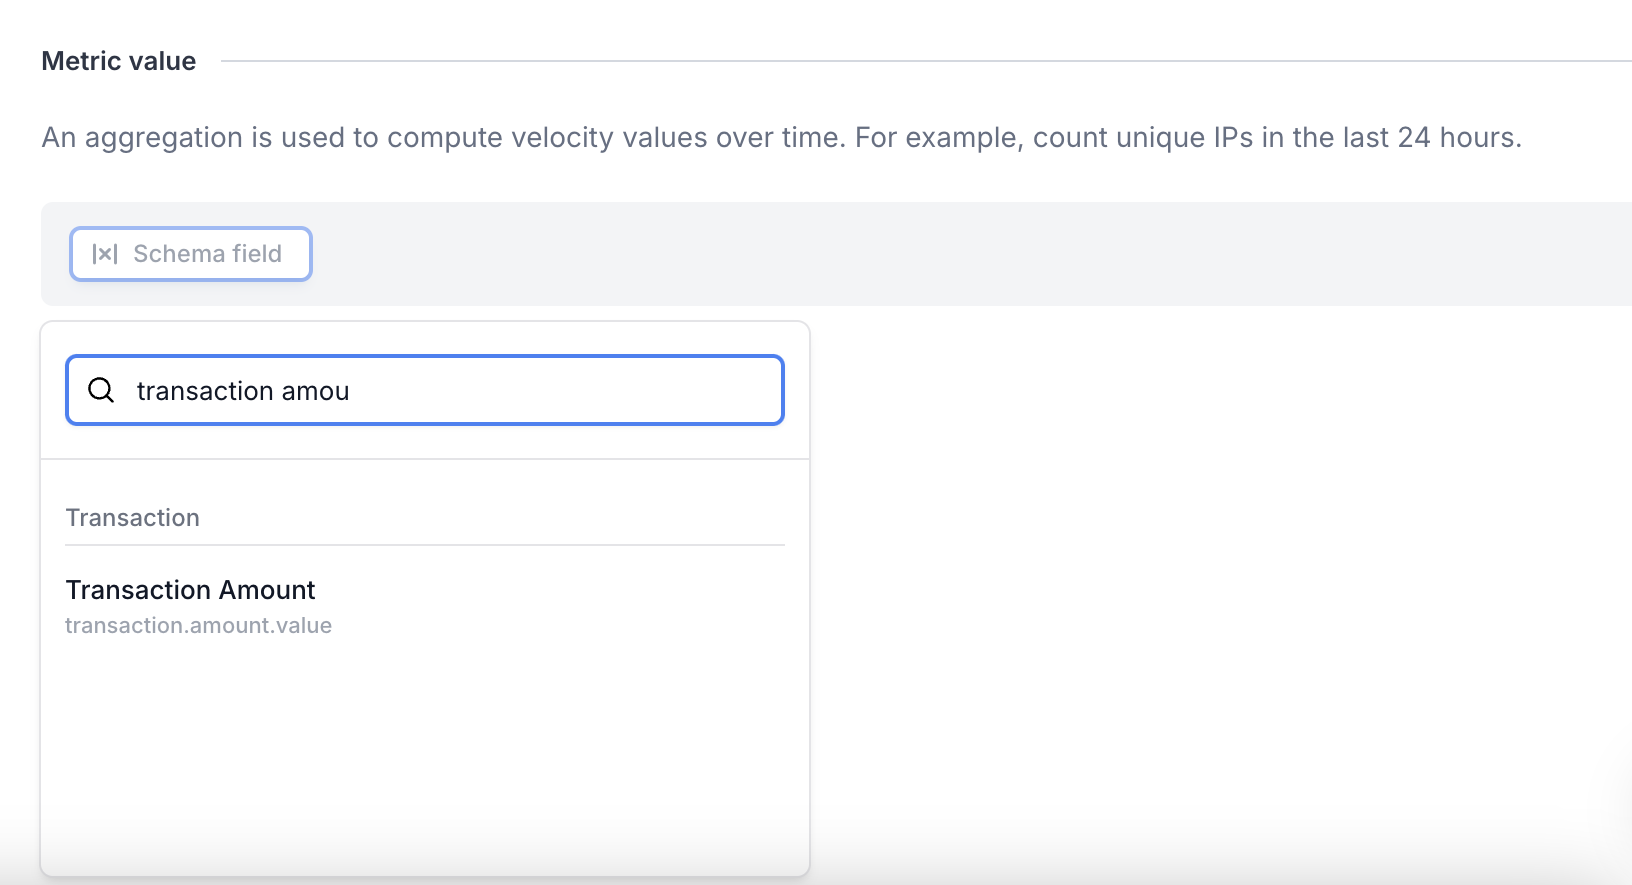
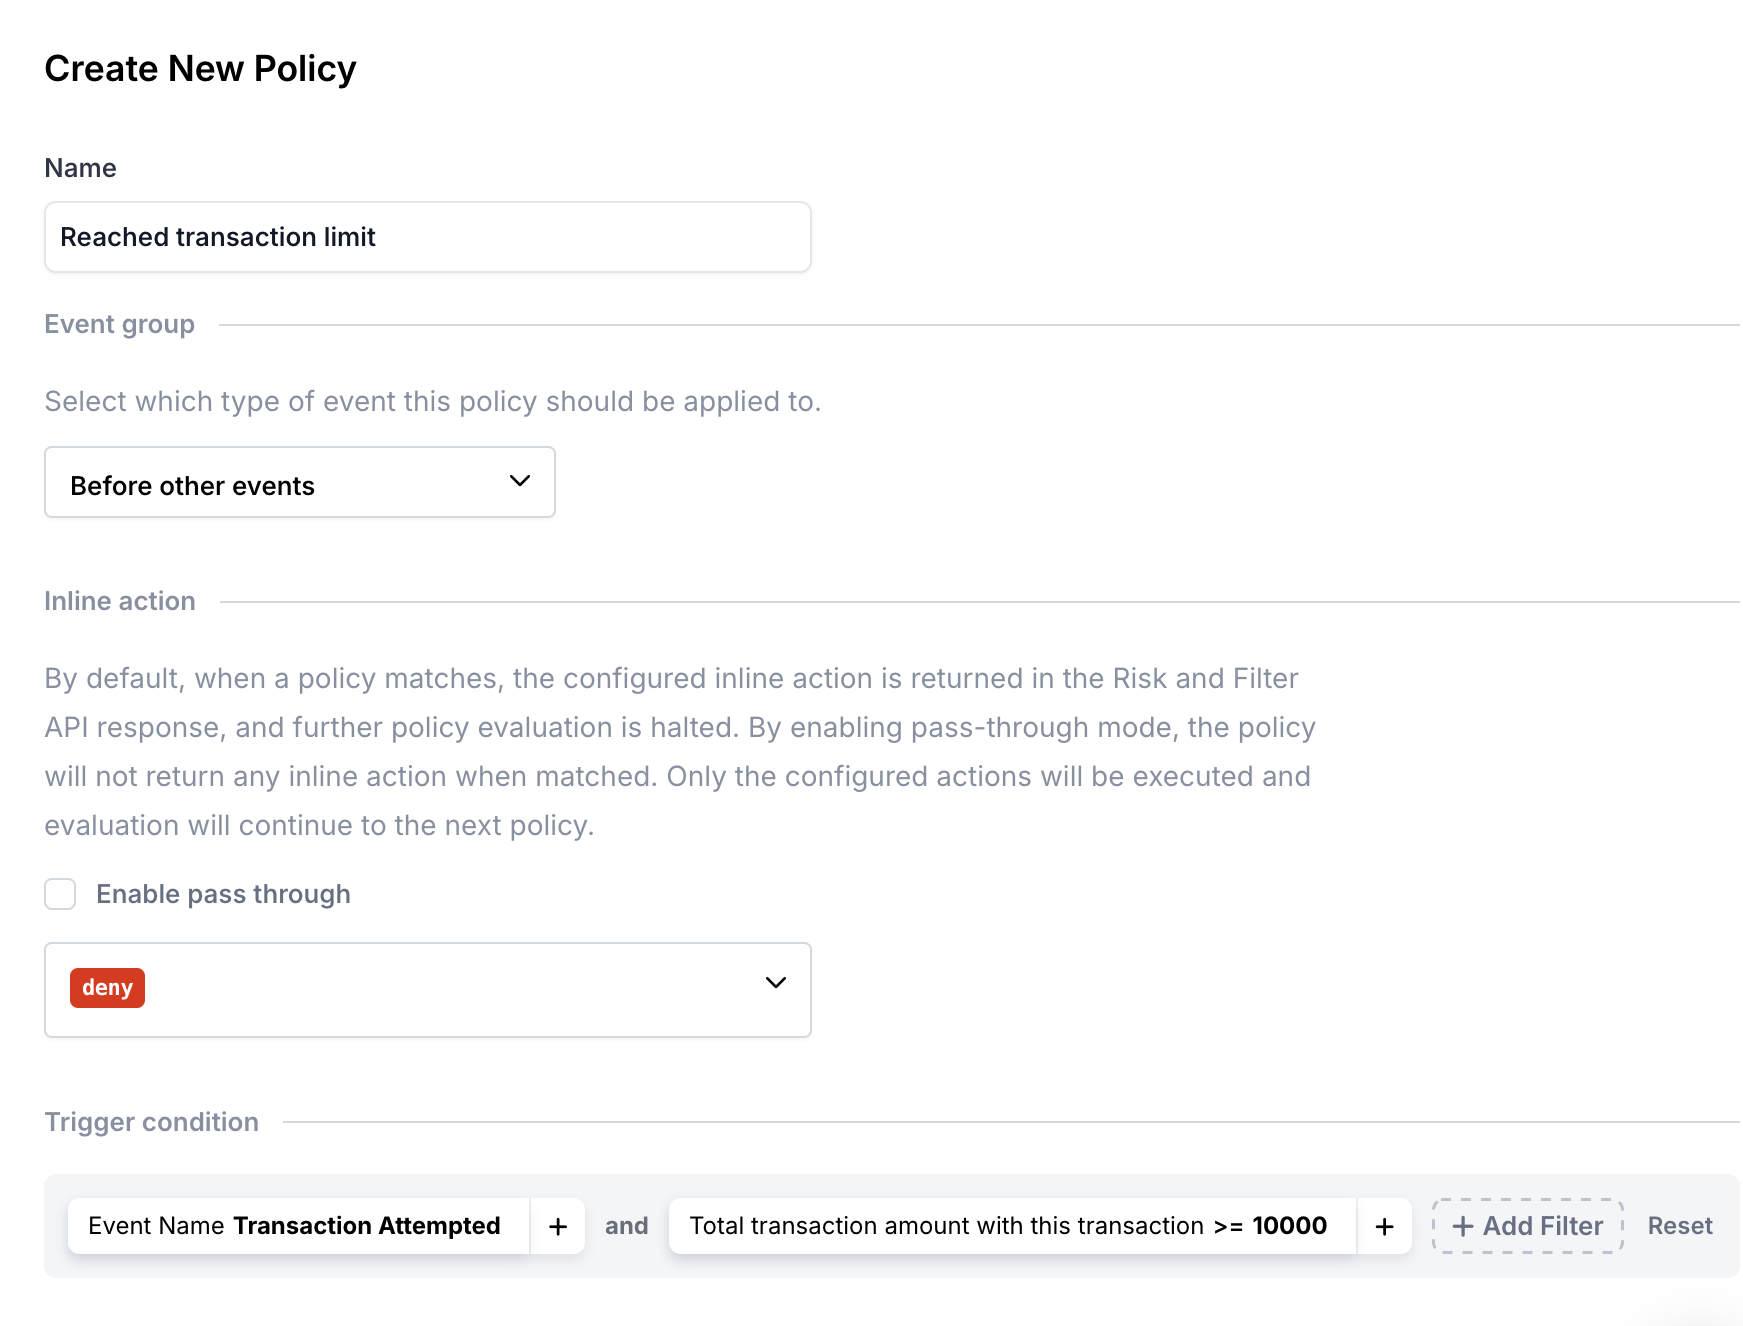
Set up a threshold limit, such as limiting the total transaction amount a user can perform in one day.
- Add the transaction amount as a Schema Field..
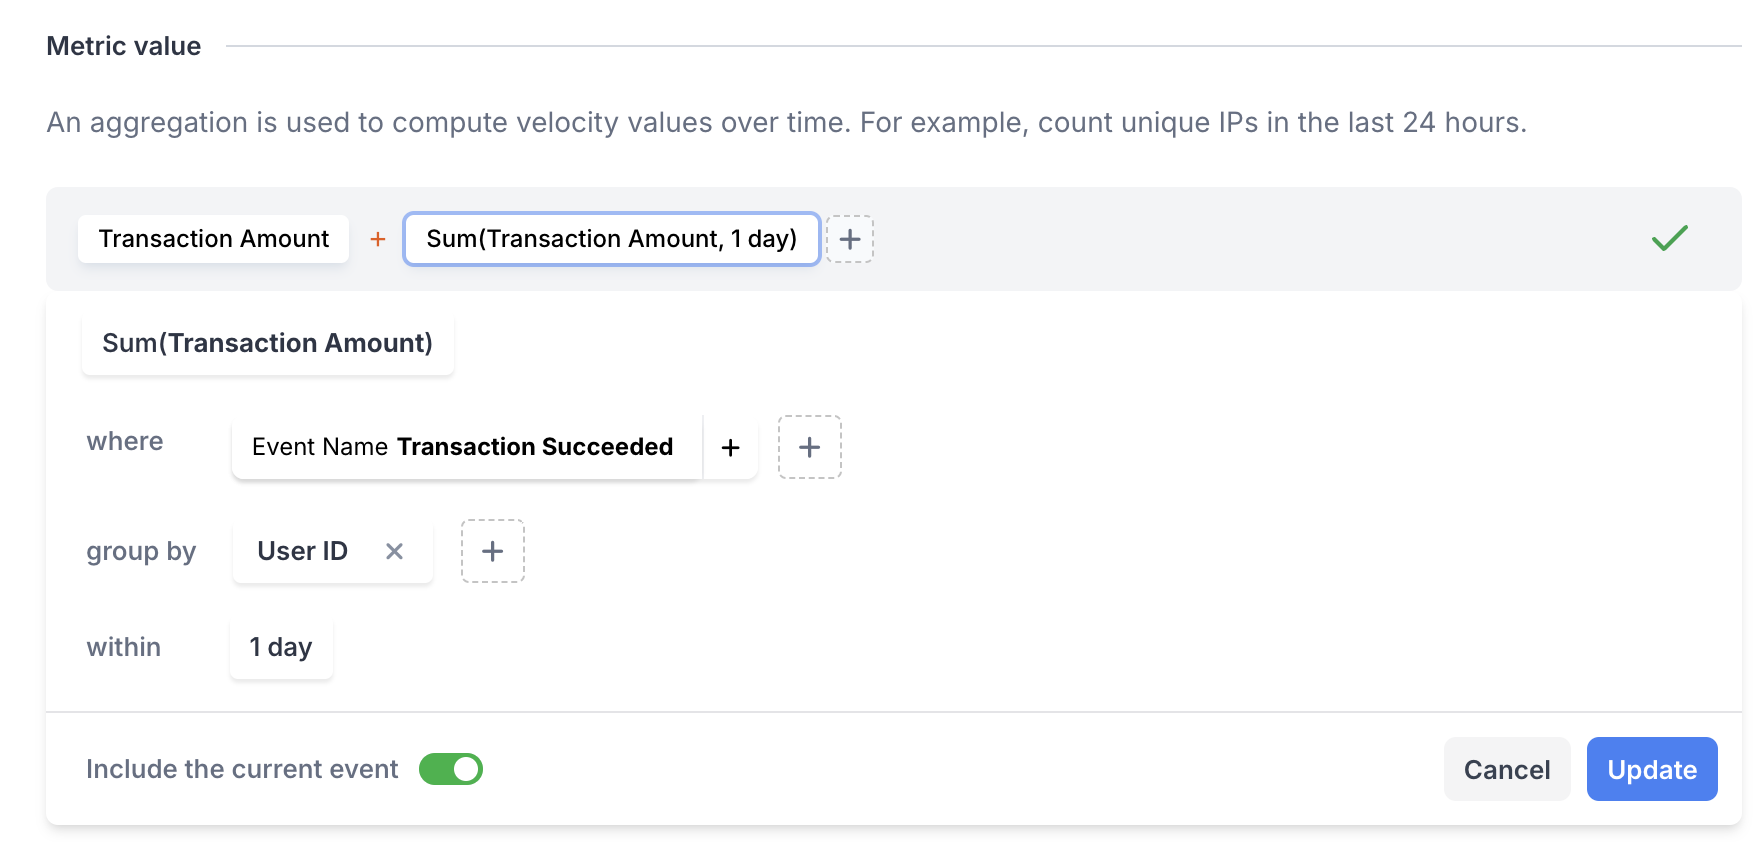
- Use the "Addition" operator..

- Count the sum of all transaction amounts for the user in the last day..
- Use this metric in a policy to restrict daily transactions based on the set threshold..
Updated about 2 months ago
