Metrics
With Metrics, you're able to set up rate limiting rules based on time and counters, e.g. to block requests with more than 10 failed logins per IP in the last hour, or when the number of users per device exceeds 2. All Metrics can be used in Policies and Custom Signals, as part of the trigger condition, and in the Explore view, where you're able to efficiently tune the thresholds based on historic data and see the impact in real time.
Castle allows to create your own business specific metrics. For example:
- Number of logins and registrations per IP, last hour. Ideal for rate limiting and blocking spam behavior.
- Number of users per device. Helpful to stop excessive multi-accounting, while allowing normal usage to go on without friction.
- Number of users per IP, last day. Also useful to strengthen your defenses against multi-accounting.
- Counts per IP, User and Device fingerprint for custom events. By using API Custom Parameters when tracking event, you will be able to utilize these custom parameters in Metrics.
- Ratio of failed logins to successful logins. Ideal to detect unexpected activity on a single account
- Time difference between events. Useful to detect rapid actions
- Threshold calculations to set policy limits like limiting the total transaction amount a user can perform in one day.
You can explore more details and examples of how to set up advanced metrics in our Advanced Metrics tutorial.
Creating a Metric
To create a new metric, head over to the Metrics page. When you create a metric, you have to define the following things:
- A name. This will appear as the reference across the Castle Dashboard, e.g. when creating a new filter of defining a trigger condition for Policies and Custom Signals.
- Description (optional). An optional longer description to communicate the intent of this Metric. This can be useful for other team members to better understand the behavior.
- A Metric Value. See below for more details. A metric value is an expression, which can include:
- Constants: Add any constant numerical value to your calculations
- Operators: Perform calculations using Addition, Subtraction, Division, or Multiplication
- Schema fields: Incorporate any schema field from the dashboard into your calculation. *Make sure to use only schema fields with numerical types to ensure accurate metric calculations.
- Brackets: Use brackets to create nested calculations.
- Aggregations: Combine multiple aggregations into a single metric. Note that at least one aggregation is required for a metric to be saved.
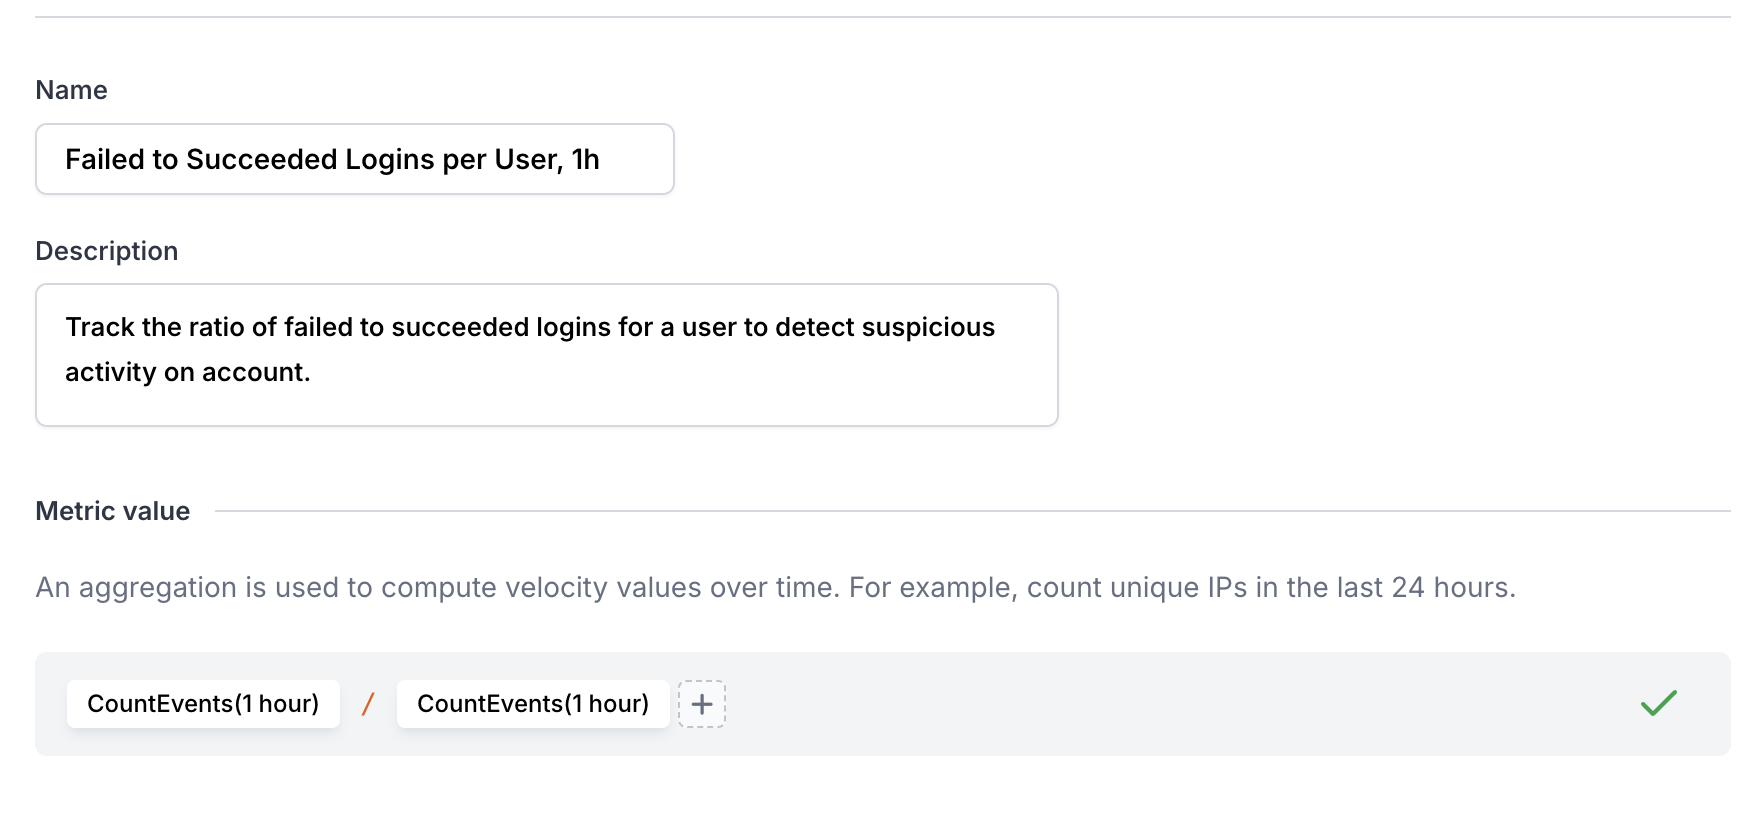
Below is an example of a metric which counts the ratio of failed to succeeded logins per user during an hour, where two aggregations are included along with the division operator.
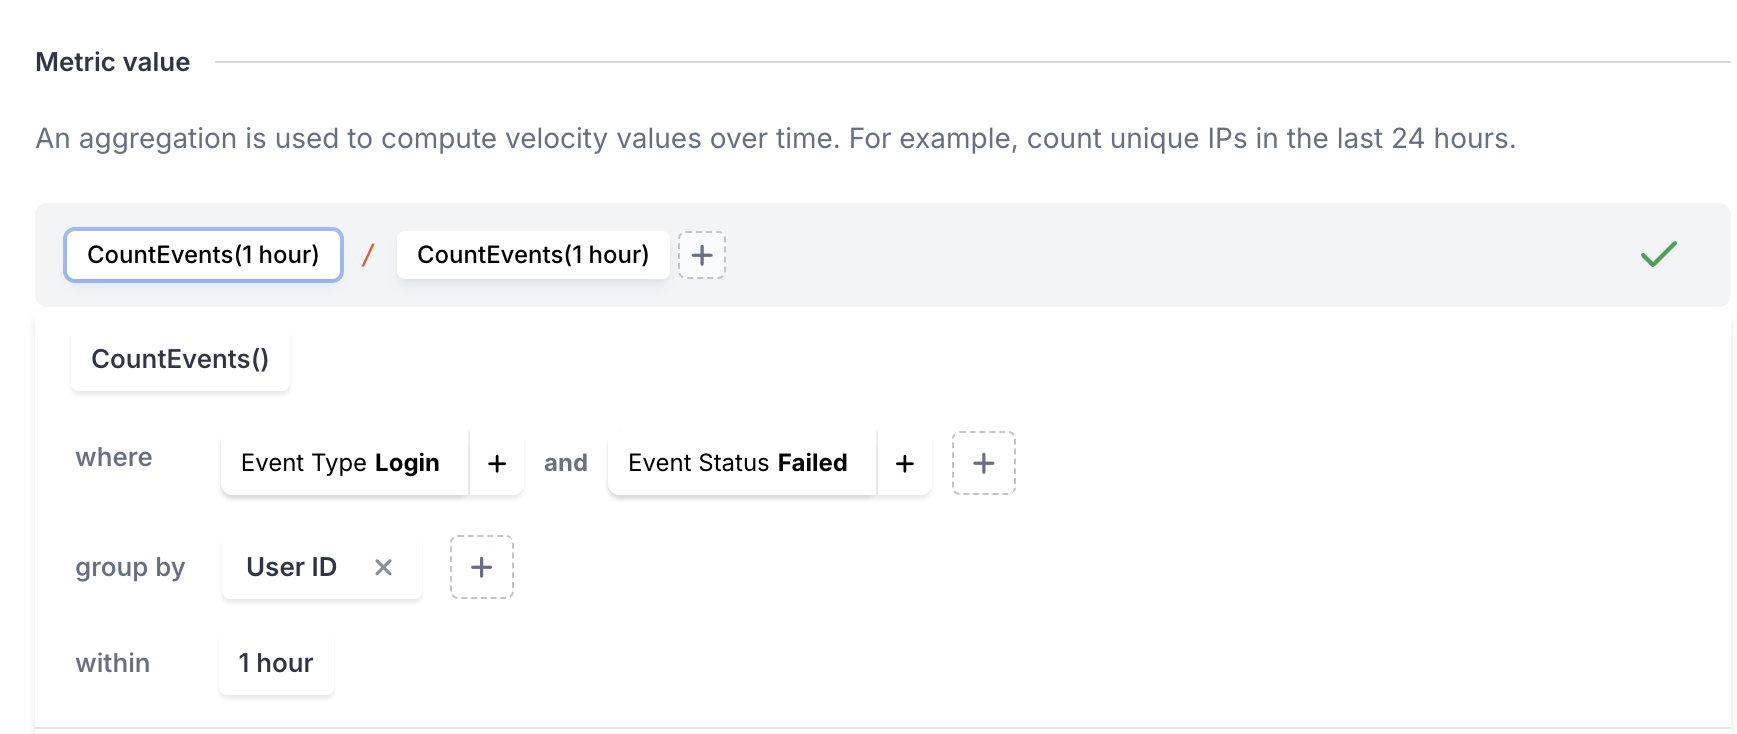
 With the aggregation defined as:
Aggregations
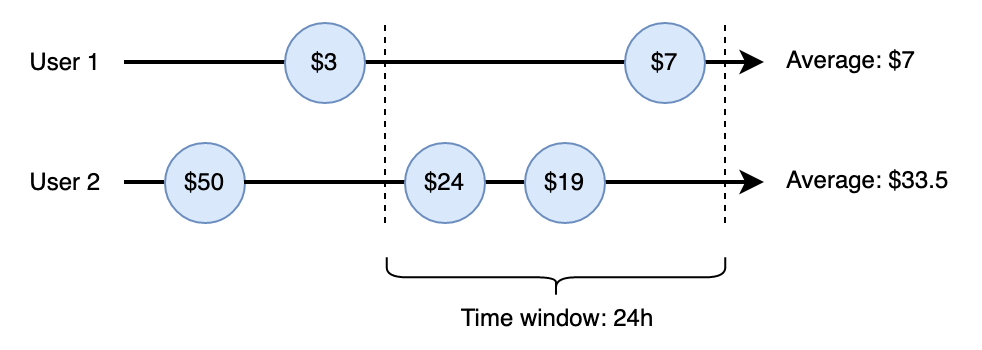
When you create a new Metric you'll have to define an Aggregation query that runs alongside and is evaluated in real-time. With aggregations, you're able to create advanced velocity checks that can detect suspicious patterns in all sorts of activities, both transaction and non-transaction. For example, compute the average transaction amount per user in the last 24h:
Defining a new aggregation is done from within the panel for creating a new Metric, and consists of a few parameters. For those familiar with SQL, parameters for an Aggregation are overall very similar to the parts that make up a (streaming) SQL statement, e.g.
SELECT $count_unique(properties.referral_code)
FROM events
WHERE name = 'Redeem'
GROUP BY user.id
WINDOW (SIZE 1 HOUR)
HAVING $count_unique(properties.referral_code) > 1 -- trigger condition, defined by the signal| Parameter | Description |
|---|---|
| Name | A short description of the Aggregation, like "Transactions per user". This will be used as a reference when defining metric value formula. |
| Method | The aggregation method together with a potential argument. Available options are:
|
| Group By | An optional argument that describes a grouping for the aggregation. For example, you can pick user.id to split up transaction volume per user instead of computing it across the entire app. You can have more than one "Group by" argument. |
| Where | Define optional filters to apply before computing the aggregation. For example, you can filter by $transaction type events to count all transactions per user. |
| Within | Time window over which to compute the Aggregation. Maximum is 180 days. |
The output from each aggregation is a value (typically a number) that is used to calculate final metric value. With a single aggregation, metric value is equal to the aggregation value. For now only a single aggregation is allowed per metric. More is coming soon. Follow our Changelog to stay tuned.
Filtering by metrics
You'll find all Metrics under filters and the "Metrics" section:
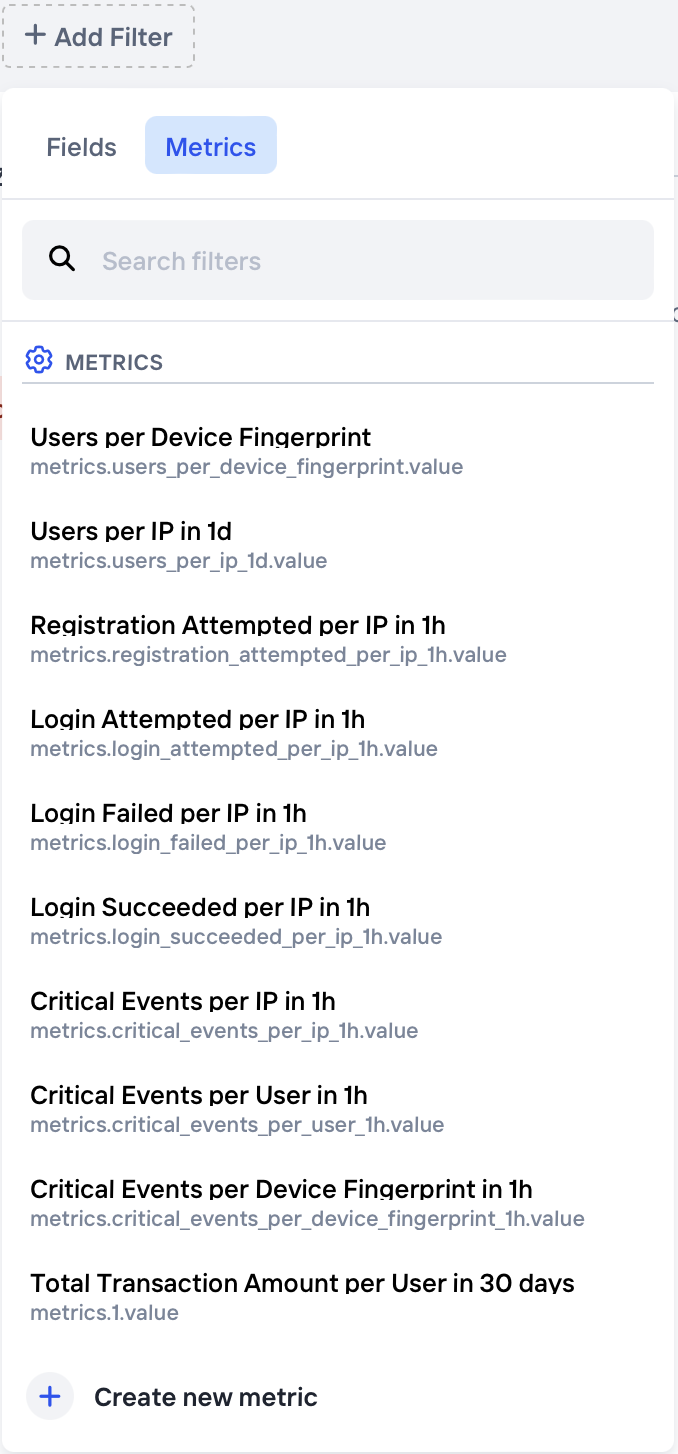
Metrics in the filter dropdown
Using Metrics in Custom Signals and Policies
Any metric can be used in filters for the trigger condition of a Custom Signal or Policy.
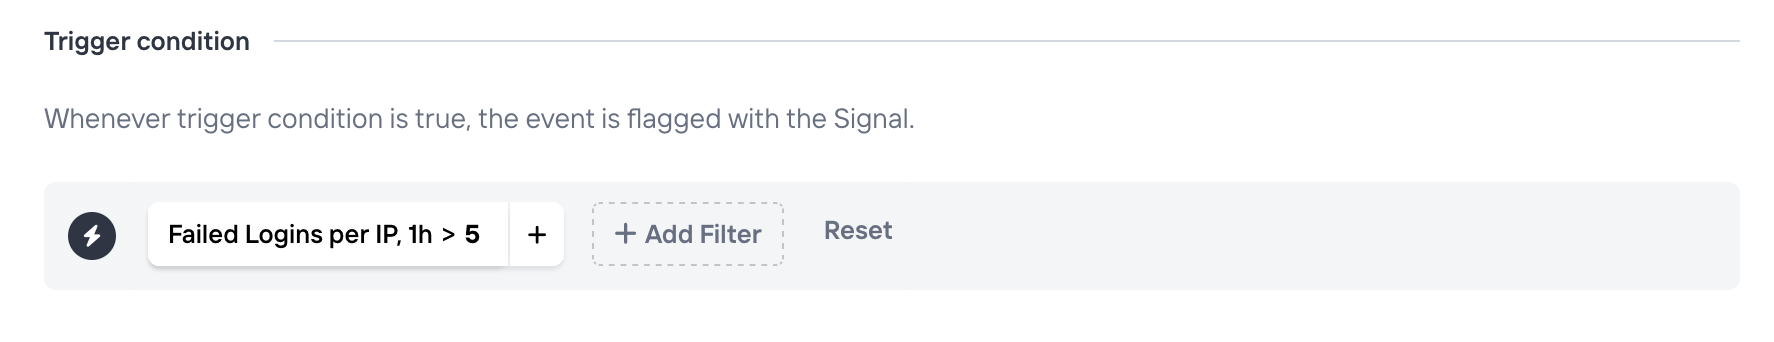
Metric in Custom Signal's trigger condition
The same metric could be re-used across multiple Custom Signals or Policies, which allows to tag events with different signals or perform different policy actions based on different thresholds for the metric. E.g. when you have multiple failed logins from the same IP address, you can setup policy to "challenge" on a third attempt and "deny" after tenth failed logins.
Managing Metrics
From the Metrics page you can perform standard action like create, update or archive metrics. In addition, these metrics can also be temporarily disabled, which means that incoming events will no longer have those metrics computed.
Inactive metricPlease note, if you disable a metric that is used in active policies or custom signals, their trigger condition won't match any events since metric value is not computed.
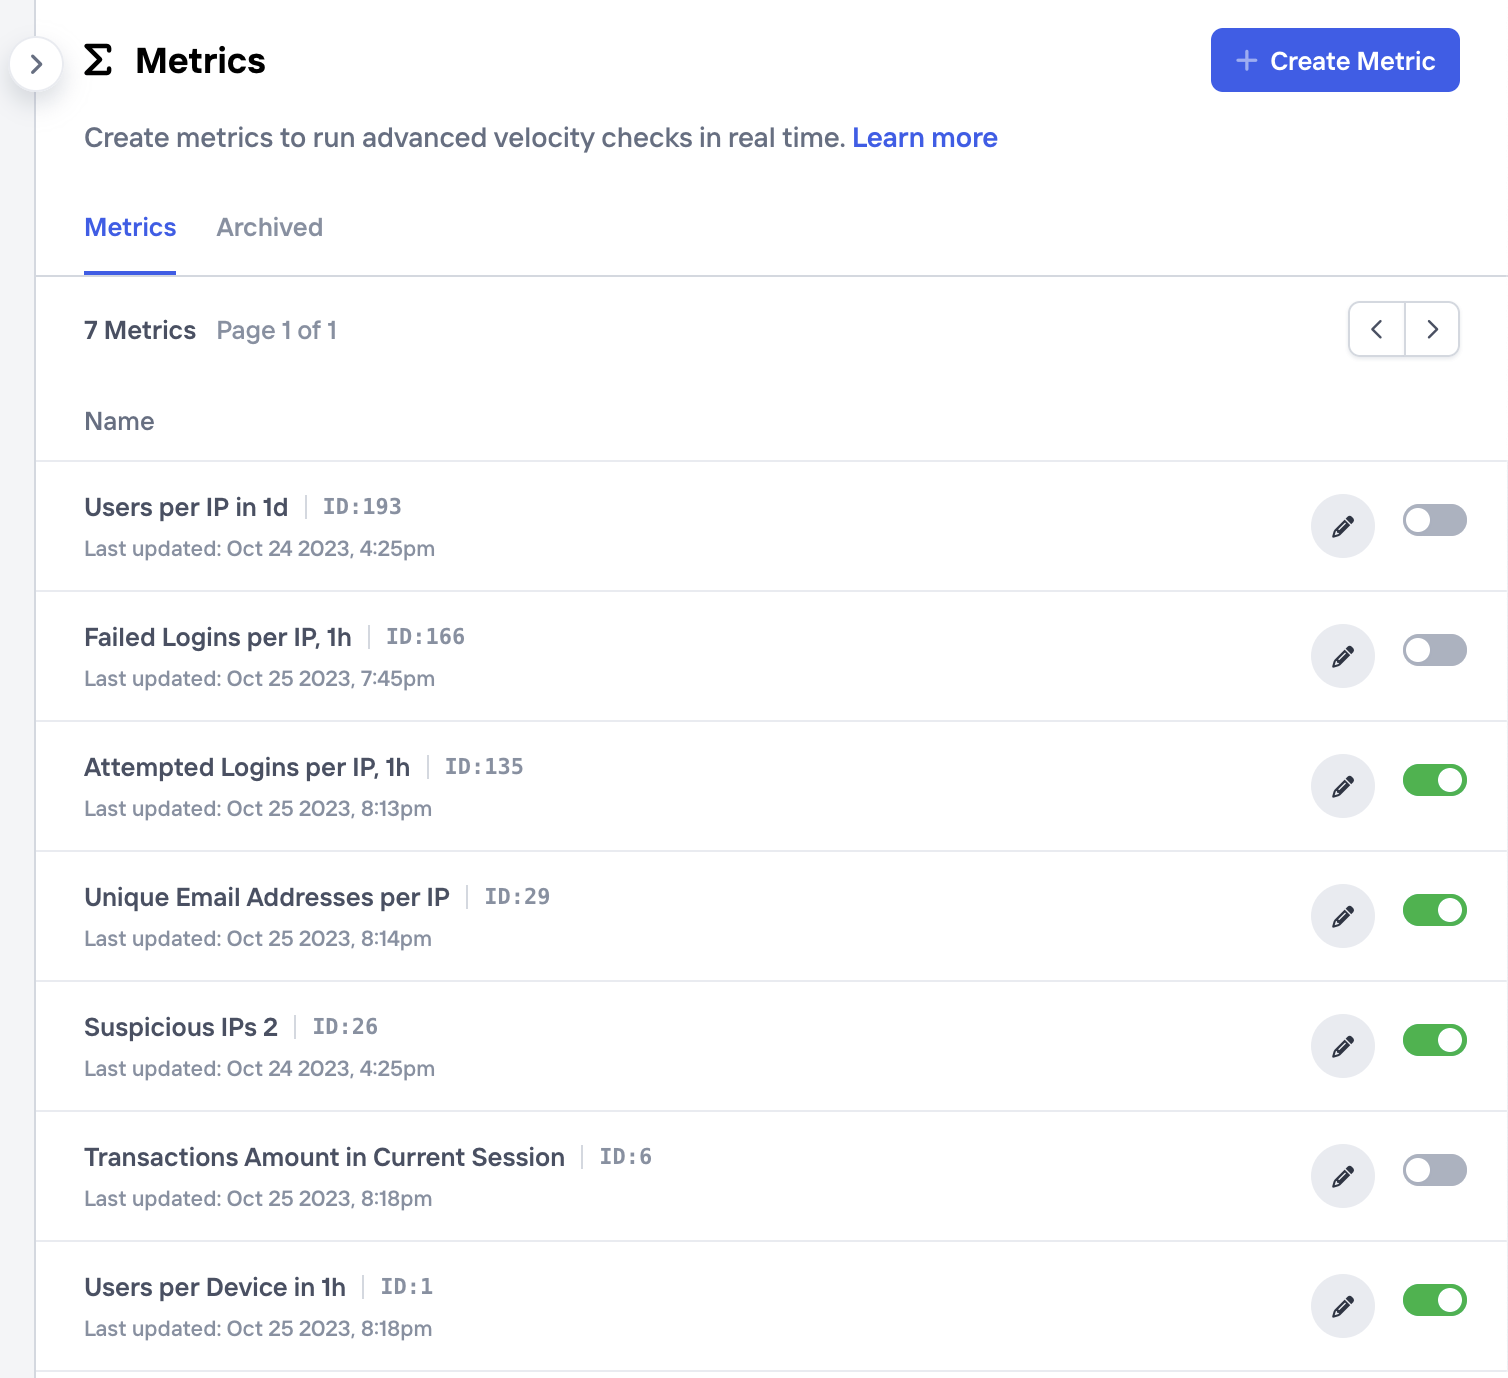
Metrics can be temporarily disabled or archived if no longer used
Updated 5 months ago