Custom Signals
By default, Castle exposes a number of Signals that each represent a unique risk behavior. If the tracked event matches, these signals show up as tags on each event record in the Caste Dashboard, so you can easily filter out the ones you're interested in. In addition to these tags, the signals are also returned in the Risk and Filter API calls, so you can implement conditional logic on the backend (however, we recommend using Policies to keep all logic within Castle instead).
In order to model and catch more business specific fraud and abuse signals, Castle allows you to create your own custom ones. For example:
- Content spamming: By monitoring the frequency and patterns of content submissions, such as comments, reviews, or posts, Signals + Metrics can flag users who may be engaging in spamming or other abusive behaviors.
- Fraud rings: Monitor unique user accounts associated with e.g. a specific device fingerprint, credit card or bank account.
- Password cracking attempts: Use a Signal + Metric to track multiple failed login attempts or password reset requests within a specific time frame or from a single IP address, alerting you to potential brute-force or account takeover attempts.
- Rate-limit abuse: If your platform imposes rate limits for certain actions (e.g., API calls or messaging), Metrics can detect and flag users who repeatedly exceed these limits, indicating potential abuse of your system's resources.
Creating a Signal
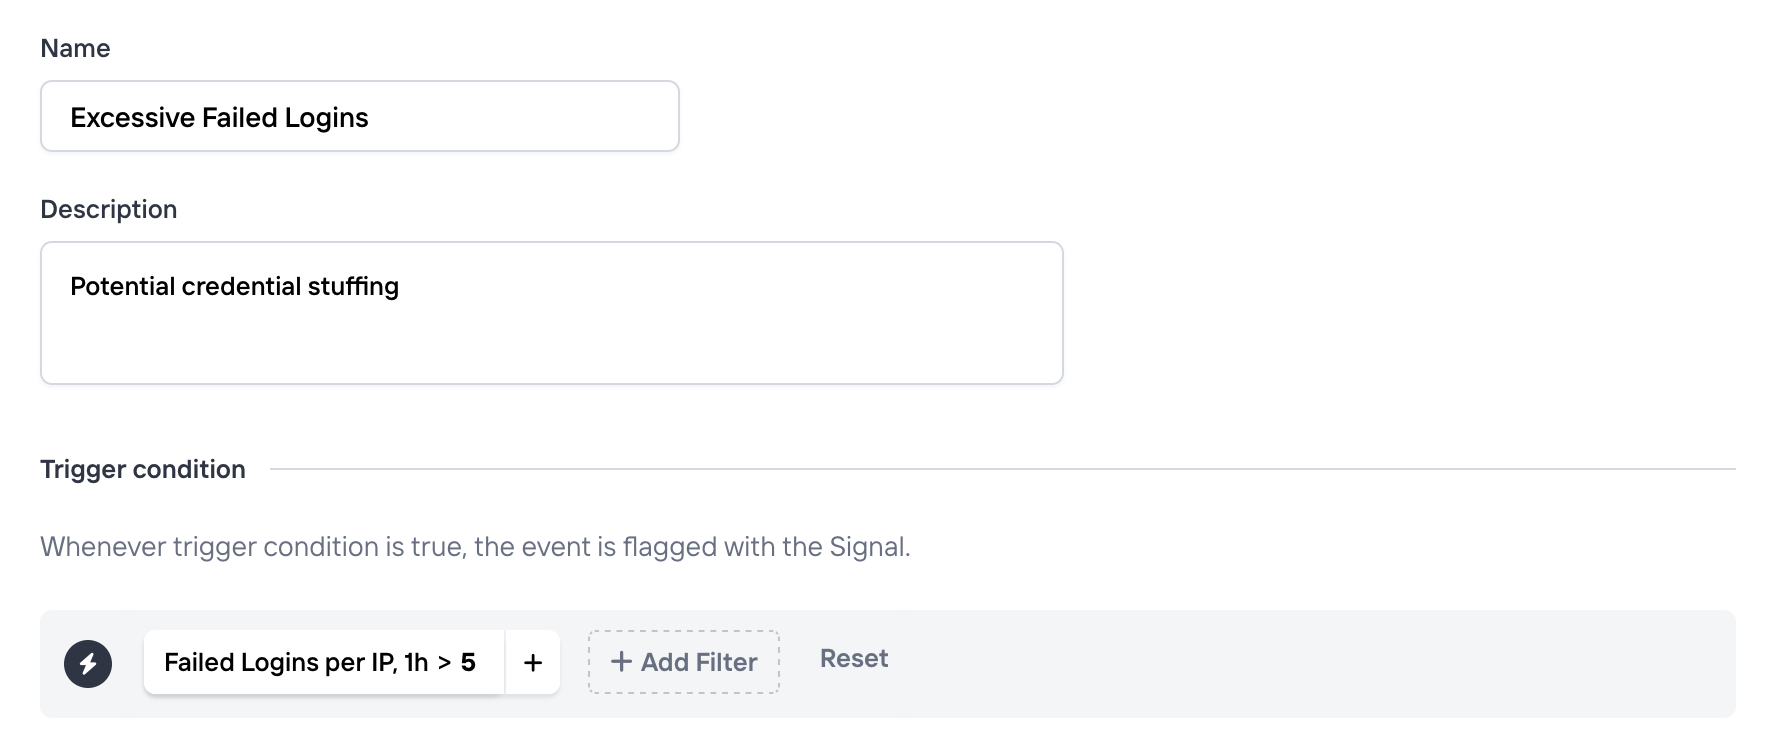
To create a new signal, head over to the Signals page. When you create a signal you have to define three things:
- A name. This will be appearing on each event where the signal conditions match. Eg. "Suspicious behavior" or "Brute Force IP".
- Description (optional). An optional longer description to communicate the intent of this Signal. This can be useful for other team members to better understand the behavior.
- A trigger condition. Defines the criteria which all incoming events are matched against. When met, the event will be tagged with the signal name defined earlier.
Using Signals
Once created, you can make use of your custom signals in a few different ways. Any custom signal will:
- Be available as a filter in the Explore view, and when creating Policies (and more generally wherever a filter can be applied)
- Be available in the API response from Risk and Filter APIs, and present in the
signalsobject whenever it matches. - Be available in the Events API in the
triggered_signalsfield.
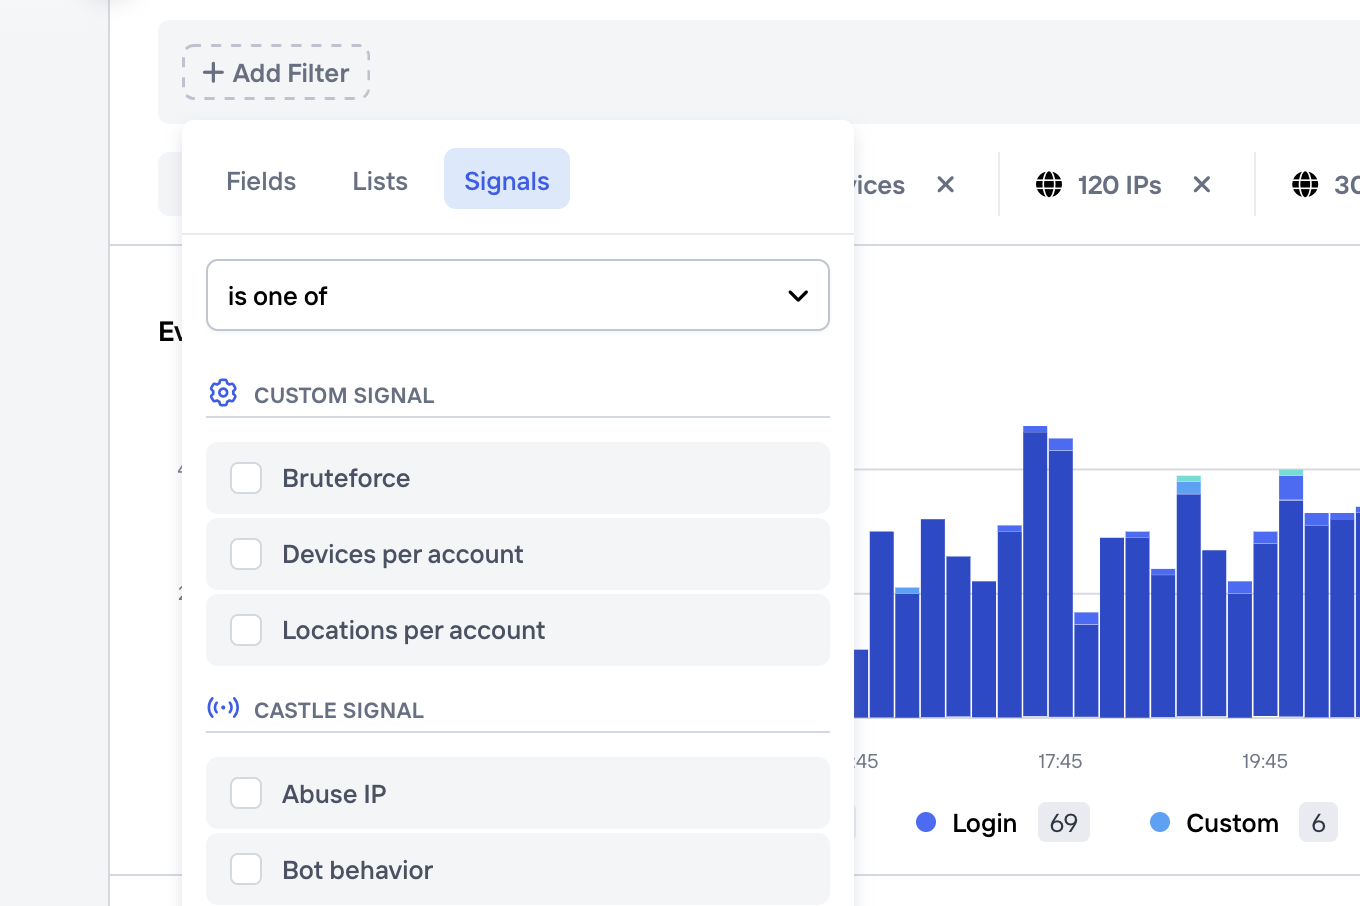
Custom signals in the filter dropdown
Managing Signals
From the Signals page you can perform standard actions like create, update or archive signals. In addition, these signals can also be temporarily disabled, which means that incoming events will no longer be tagged with this signal name when matched. Please note that if you've defined an Aggregation as part of the signal, this will also stop being computed.
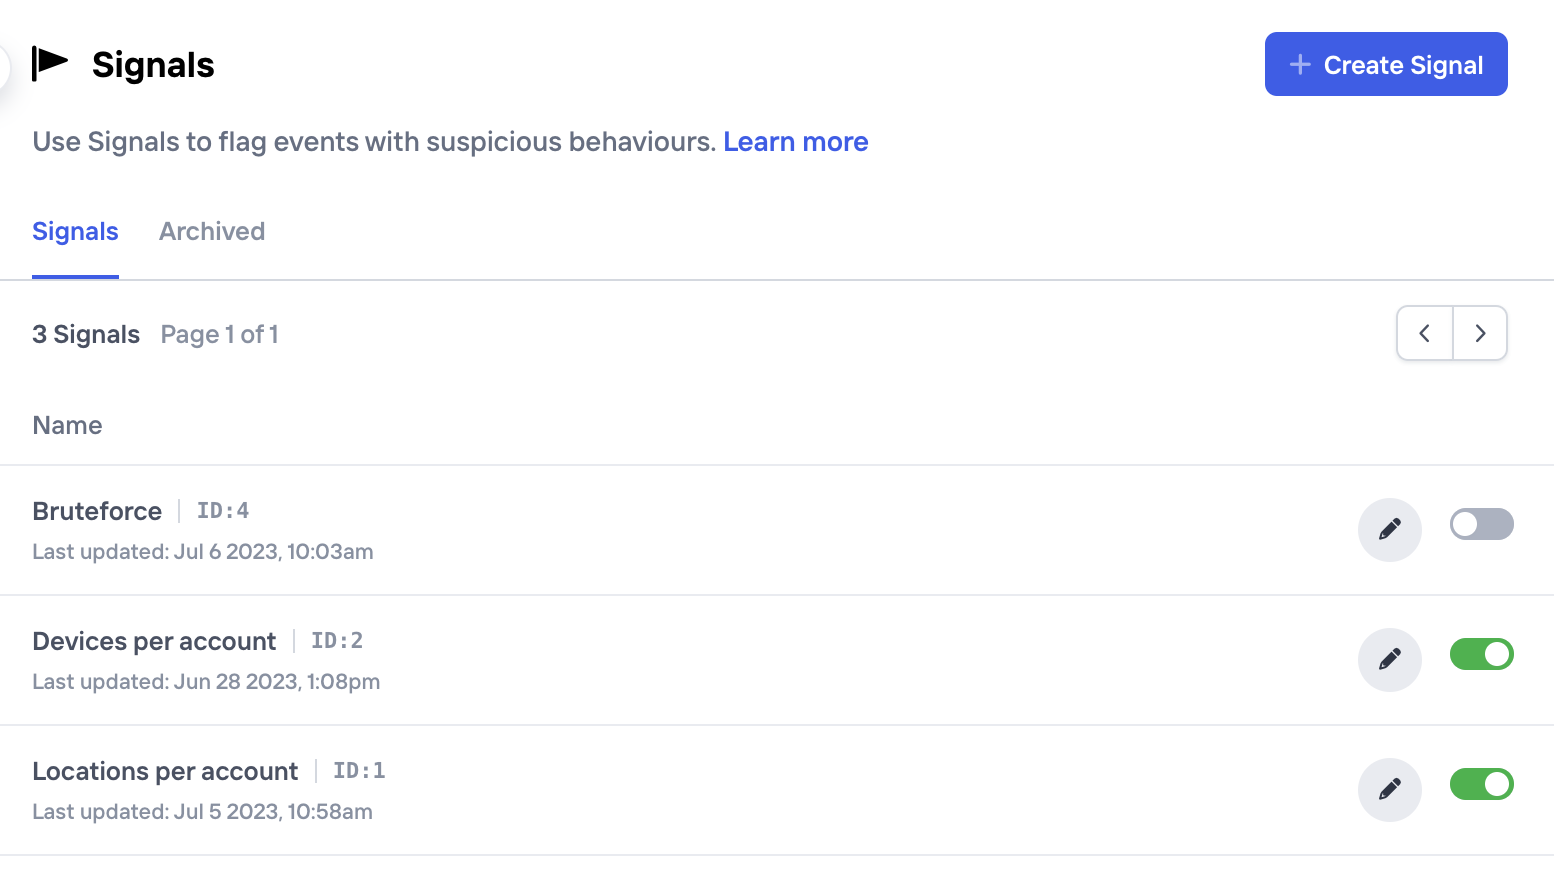
Signals can be temporarily disabled or archived if no longer used
Updated 7 months ago