Overview
Discover how Castle's Overview Dashboard provides a comprehensive snapshot of your app's security, helping you effortlessly monitor and enhance your defenses.
Castle designed the Overview Dashboard to help you understand your app's security at a glance and compare it to a previous period. This dashboard provides a simple executive summary of login and registration events, as these are the two most critical events from a security standpoint.
The summary is divided into two parts: Event Insight and Response Insight.
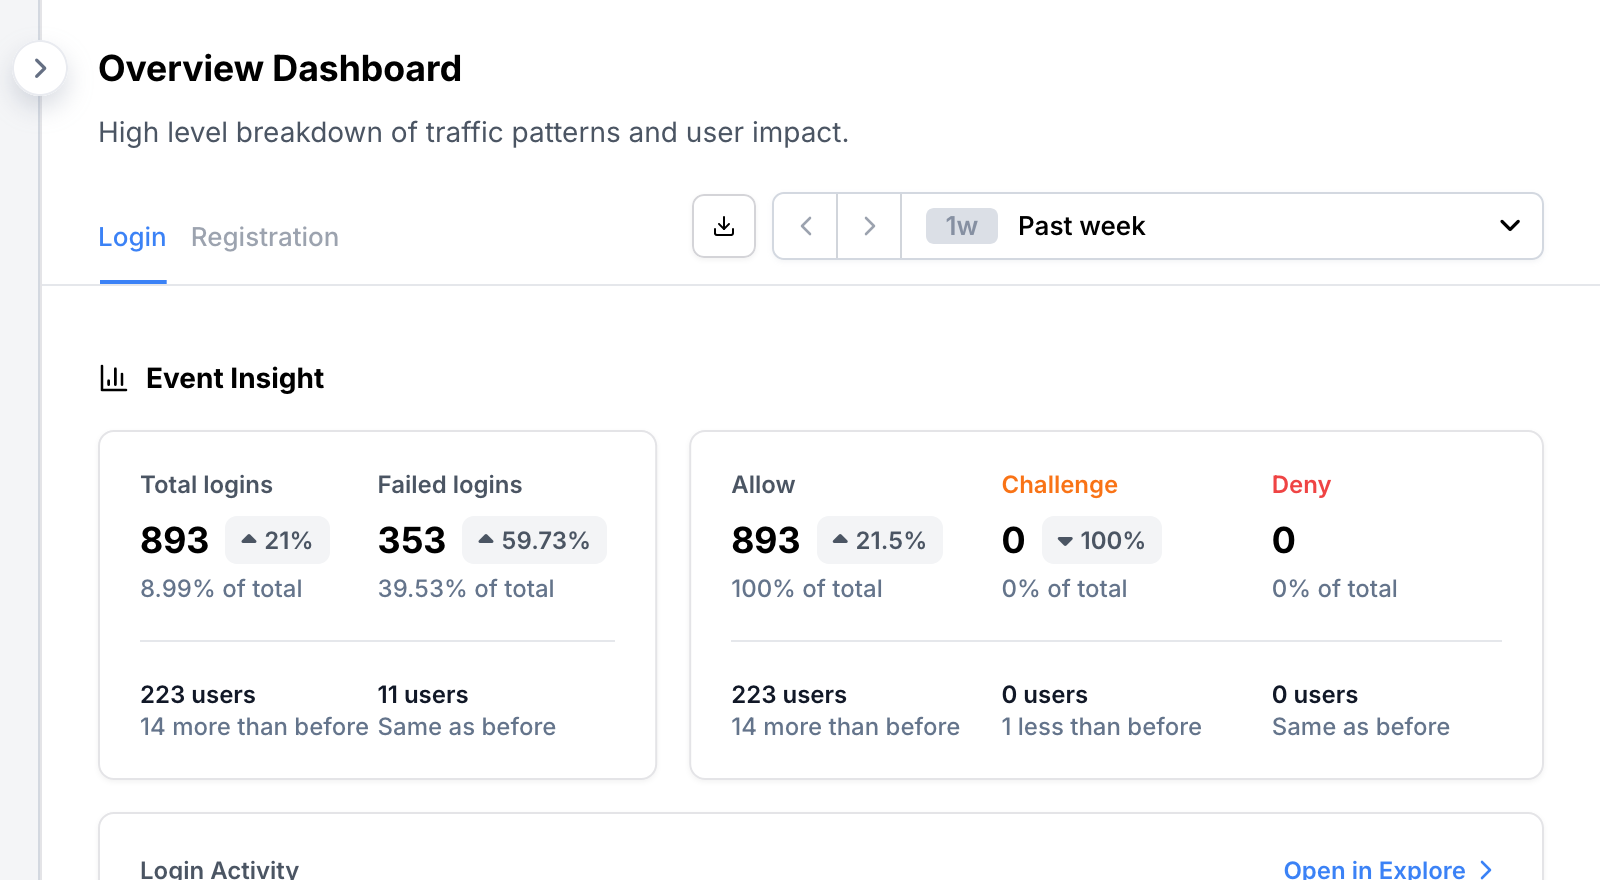
Event Insight
Event Insight provides a summary of activities over the past week. You can also select different time periods, such as the past day, past week (default), or past month. In this example, insights are provided for the Login event.
This insight offers a quick look into your app's activity:
- How many times did users log in to the app?
- How many login attempts failed (for example, due to invalid passwords)??
- How often did your policies return Allow, Challenge, and Deny responses?
- What changes occurred since the previous week? How did events and responses evolve?
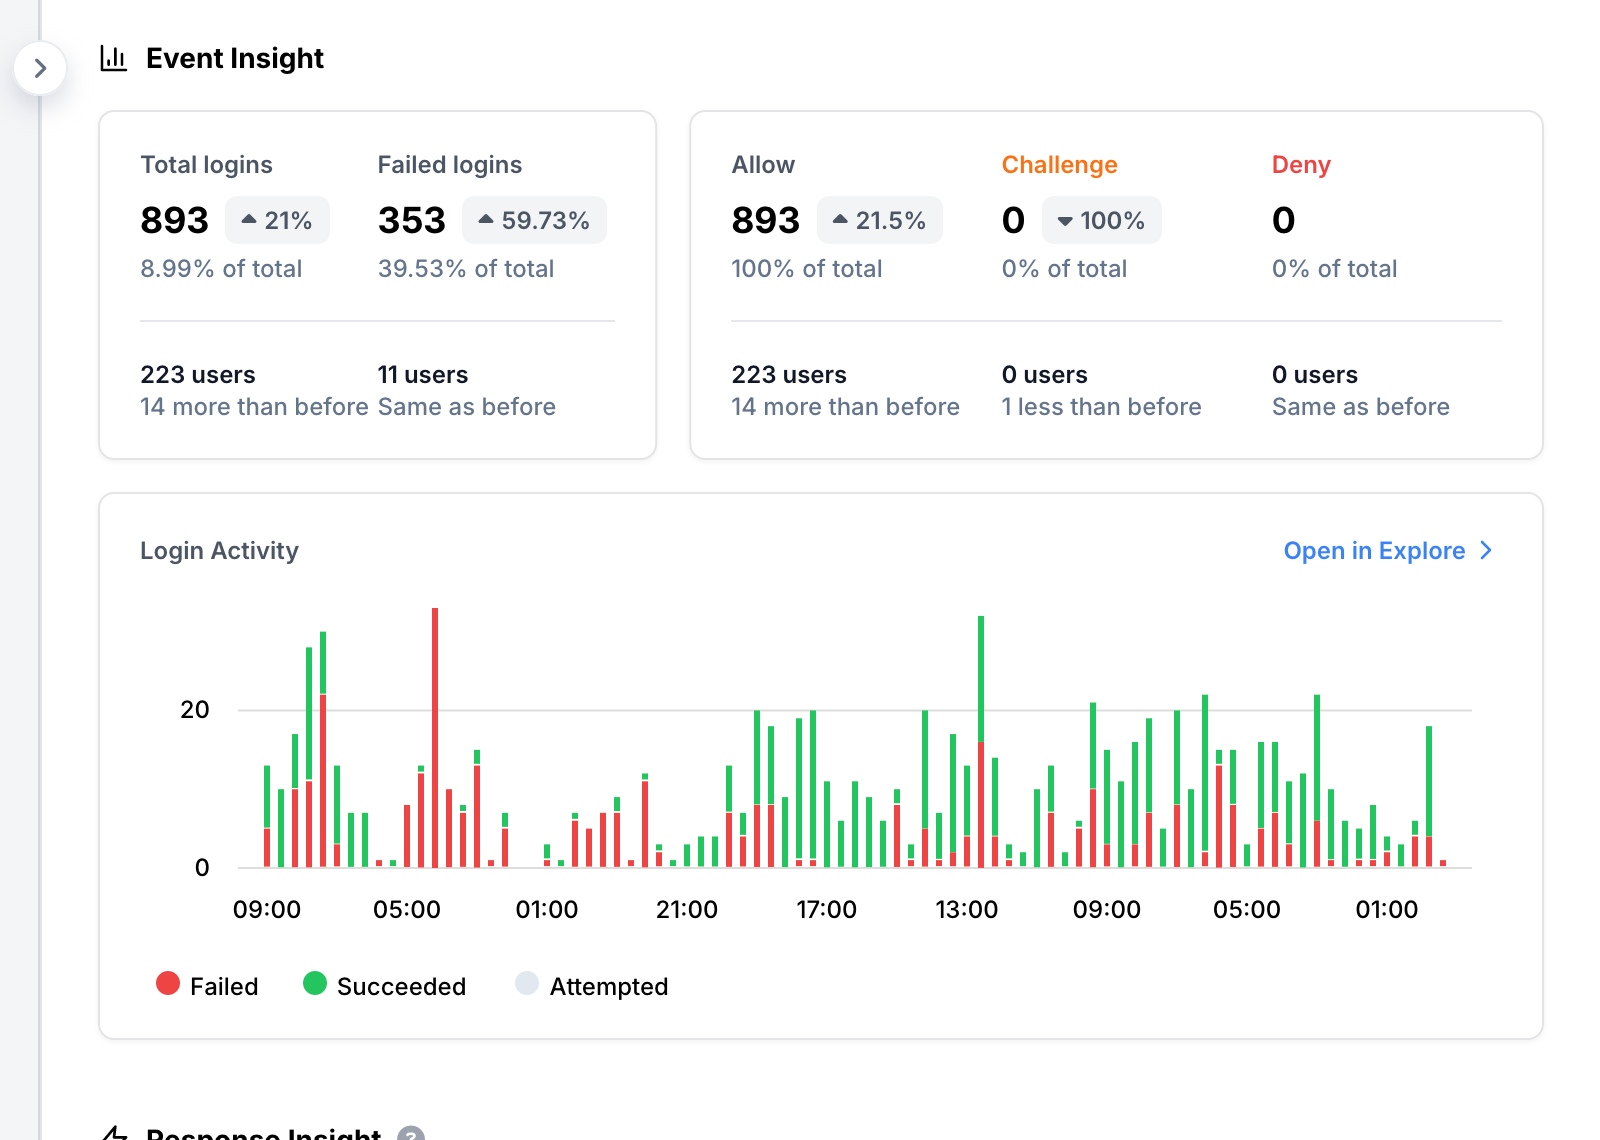
Below this information, you can see a chart indicating whether your app is under attack. For example, an increase in failed logins might suggest a credential stuffing attack.
Response Insight
Response Insight summarizes triggered Policies and Signals. It highlights which Policies were most frequently executed and which Signals were most commonly observed. These insights help you understand how your policies impact users.
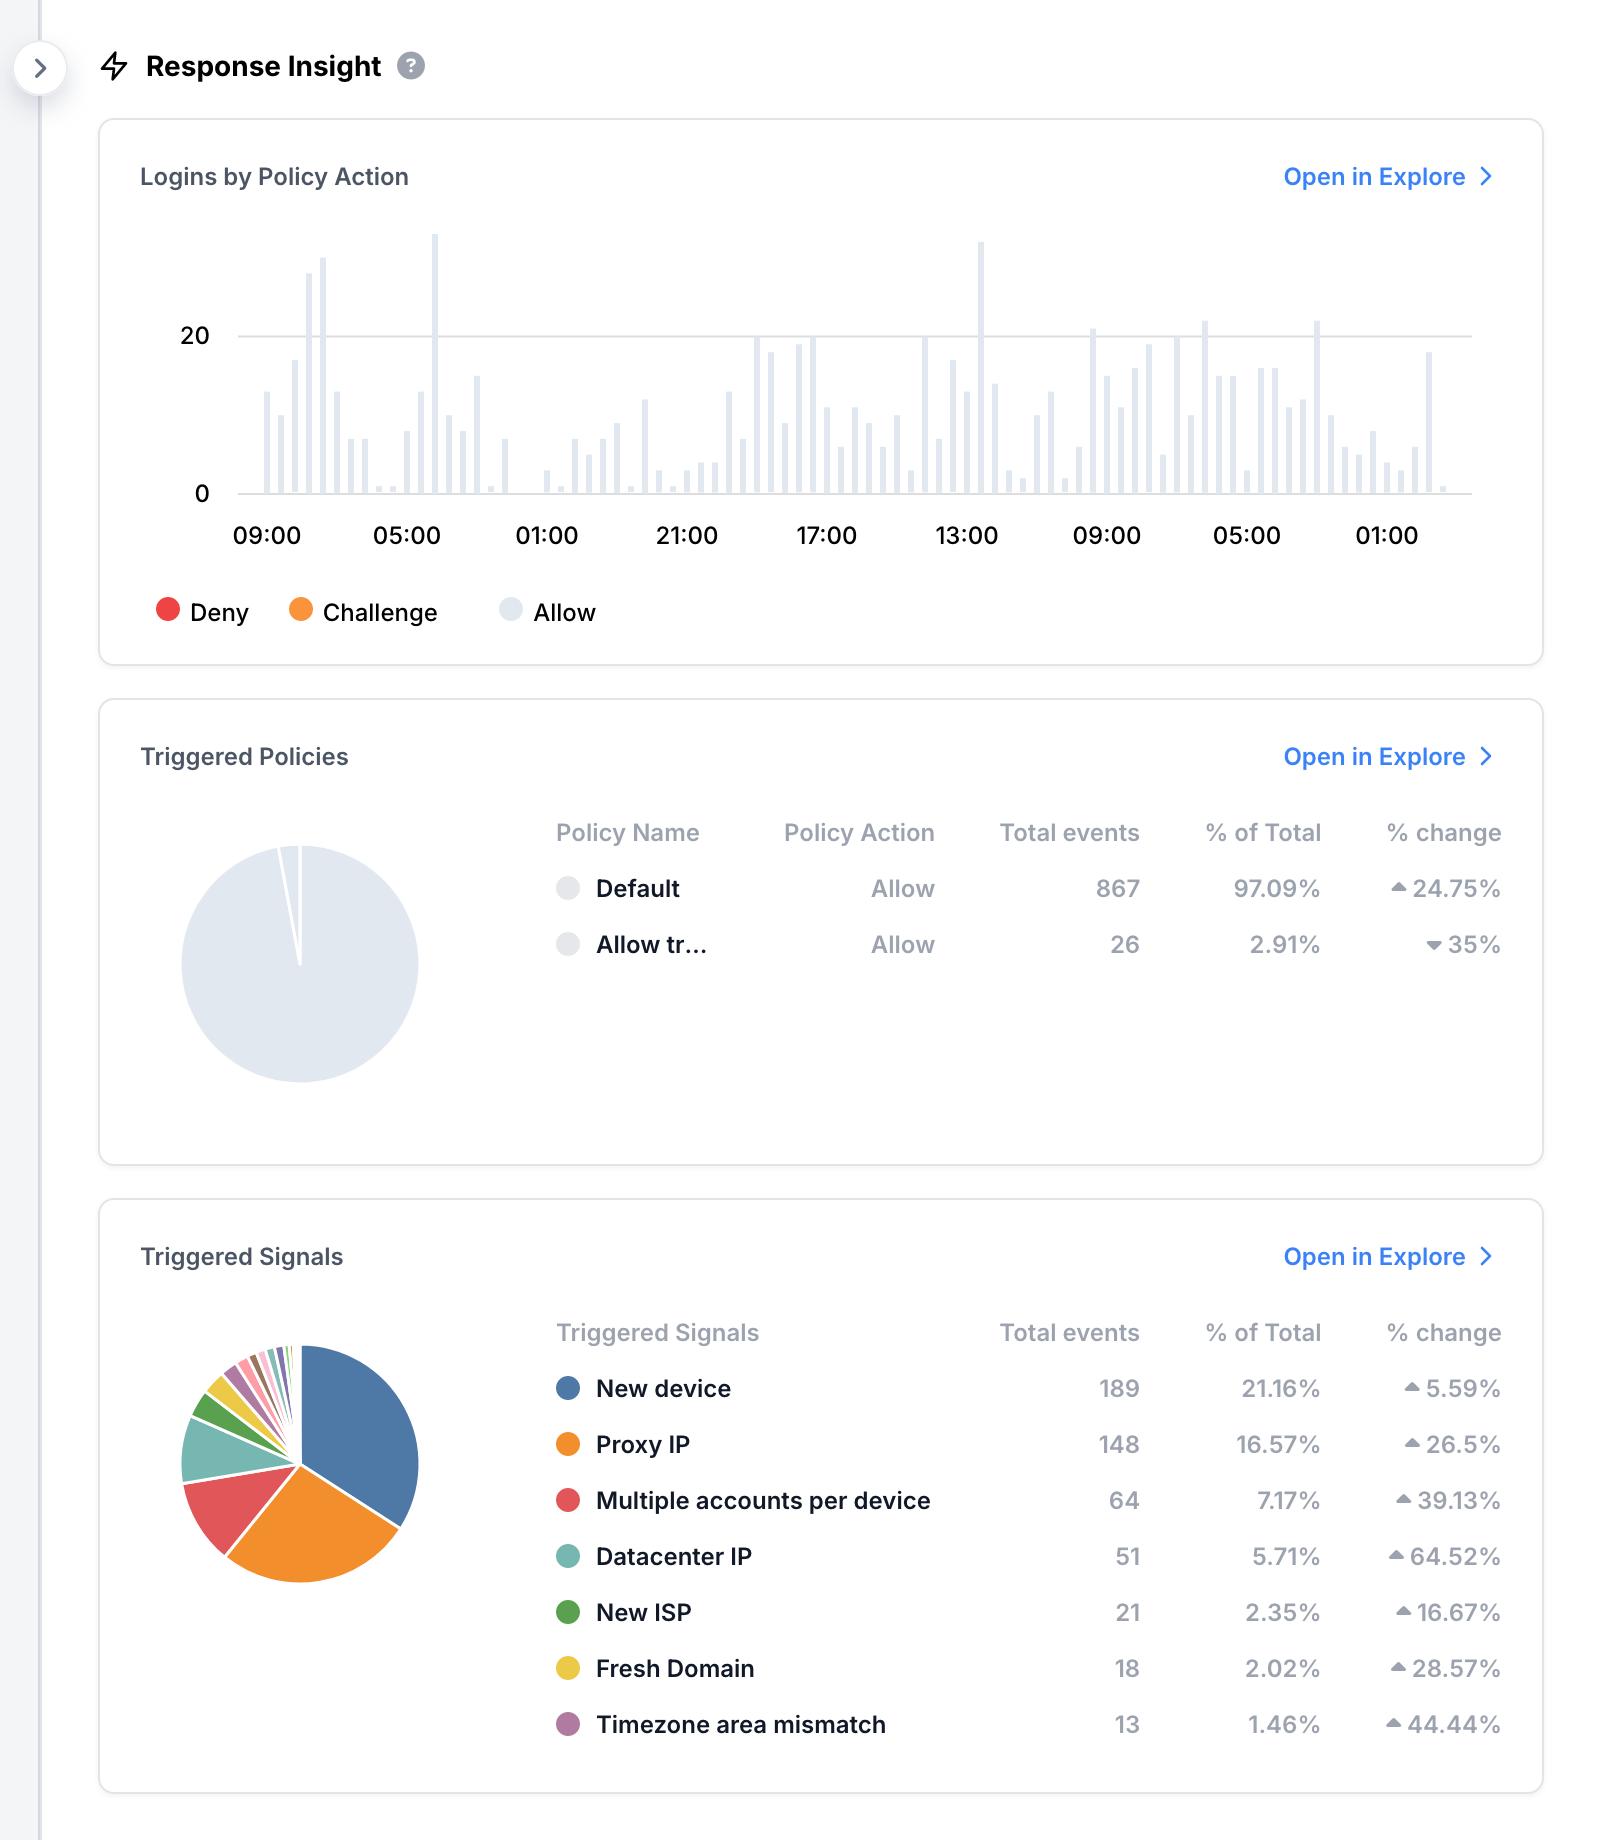
The Policy Actions chart helps you understand when Castle prevented attacks. By comparing Challenge and Deny actions to the Activity chart, you can determine if your policies successfully intercepted an attack or if adjustments are needed.
The Triggered Policies chart shows which policies are most often triggered, helping you identify frequent types of abuse in your app.
The Triggered Signals chart displays the most common signals in your events, providing insights into unexpected behaviors within your app. Use these signals to strengthen your policies or gain a better understanding of your use cases.
Share the Overview with executives
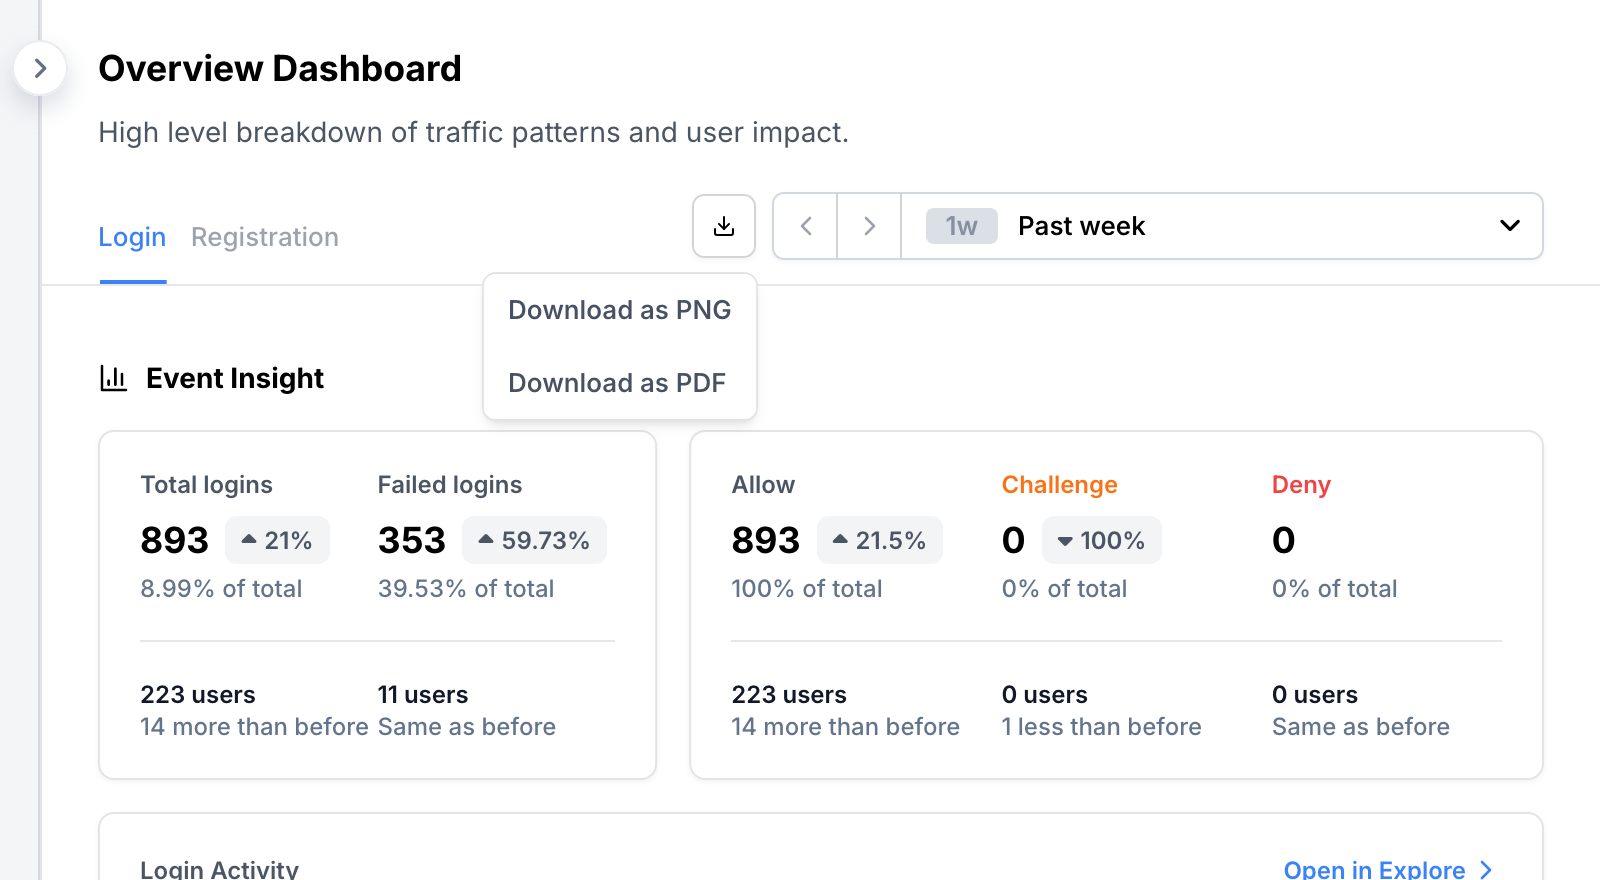
Sharing your security overview is easy. Click the download button near the period picker and select a format: PNG image or PDF file. You can insert these into presentations or attach them to emails for your executives.
Dive deeper into interesting details
Each insight on the Overview Dashboard is a starting point for further exploration. Whenever you see something interesting, click the "Open in Explore" button to dive deeper into the details.
Updated 8 months ago