Exploring data
The first view you'll see when logging in to the Castle Dashboard is the Explore view. This is also the place where you'd start exploring your data, everything from high level patterns and outliers down to activity streams for individual users.
Filtering
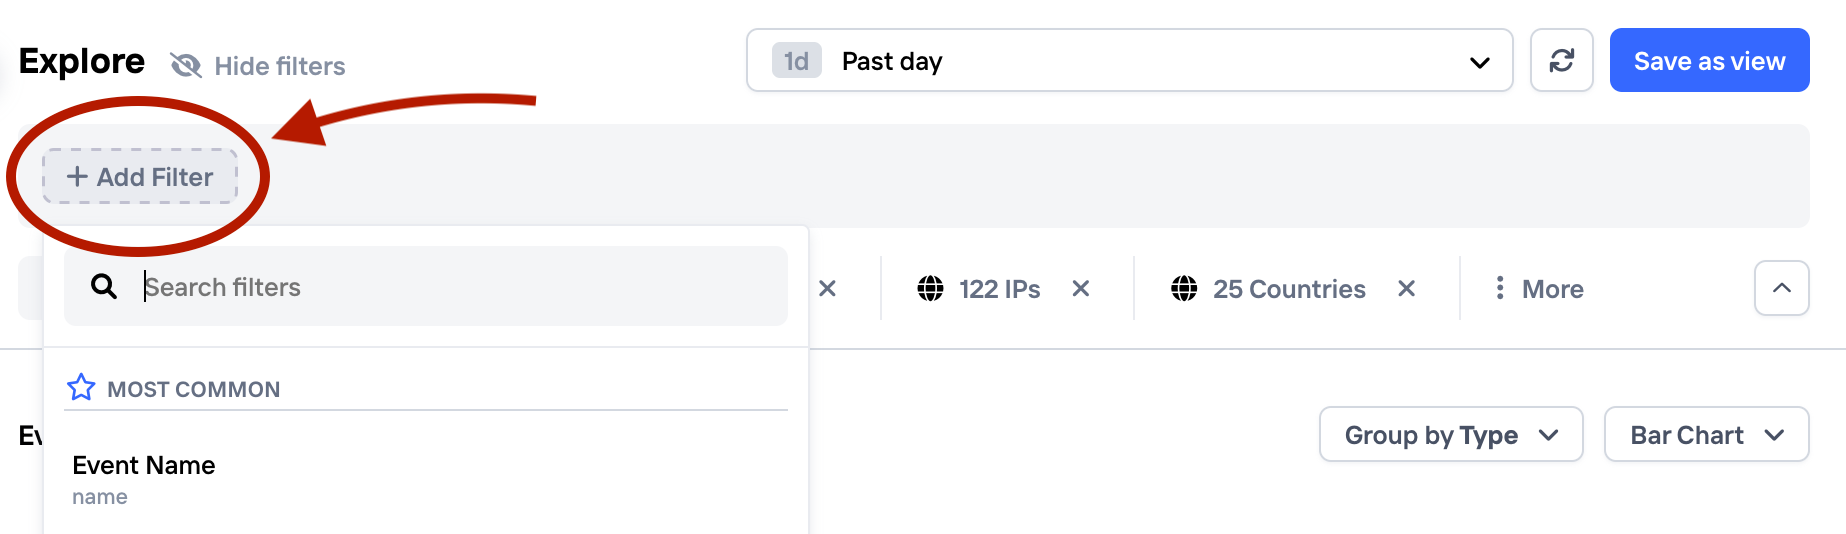
By clicking "Add Filter" in the Explore view, you can see all the available options
Castle exposes a set of powerful filter capabilities to allow you to narrow down on interesting patterns in your data. Some notable features include:
- Filters can be applied to any of the 100+ event fields, including custom properties.
- A large set of operators, such as
equals,contains,is one of,start with,end with+ their negated equivalents. Plus for numeric valuesis betweenis greater thanandis less than. - On top of the operators above, string fields also supports Regex, which adds another dimension of flexibility.
- Combine multiple filter groups with AND/OR operators.
- Temporarily disable a filter to see the impact with and without it
- Quickly add a new filter by clicking on any value in the results
Grouping
Grouping is a really powerful feature of the Castle Explore view that allows you to quickly reveal e.g. multi-accounting related fraud by spotting subtle patterns and relations, or dig into credential stuffing attacks to reveal the clusters of bad IPs or devices.
By default, the Explore view comes with a set of useful groups for Users, Devices, IPs and Countries. You may add, modify or remove these groups, using any of Castle's event string or enum based event fields.
How to add a new group tab + apply a filter
Grouping by custom properties
In addition to all the standard event properties that Castle provide, you're also able to group by any custom property you send. This opens up tons of new ways of honing in more closely on fraudulent groups of users by allowing powerful exploration capabilities on your business specific data. For example, grouping by organization name will quickly give you a breakdown of number of users, events and devices per organization as well as any custom aggregation columns (see section above for more on columns).
Advanced table filters
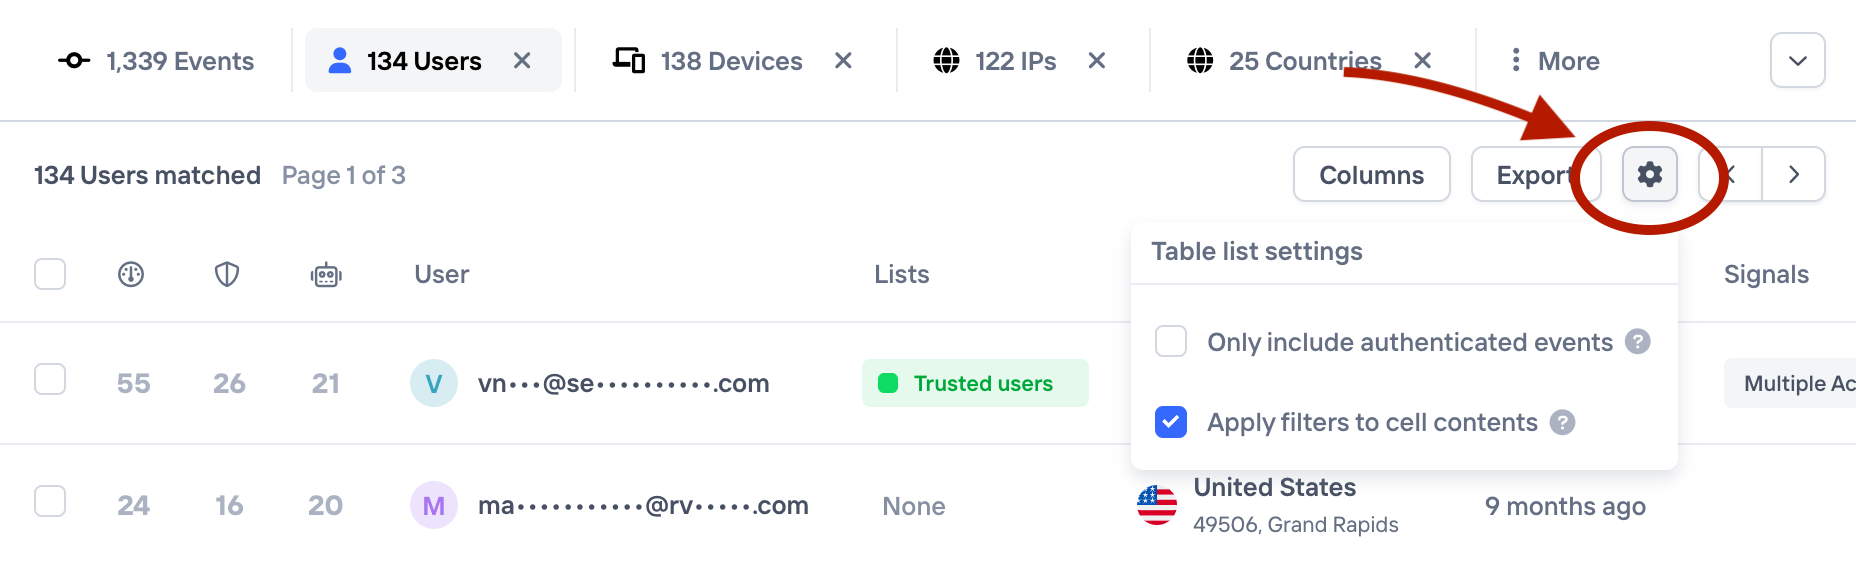
For any result table present in a group tab, there are two options available that controls how the resulting rows are computed:
- The ability to only see authenticated events. This enables you to only view data based on the truly authenticated user activity, and not from e.g. failed login attempts which are matched to users by default.
- The ability to display table contents based on the full data history. By default, the table cell content is based on the same filters as you've configured in the main filter area at the top. With this option you can e.g. instead see the number of events, devices, IPs etc. across unfiltered data, which is useful to get a sense of the overall activity for each entry.
Advanced table filters
Columns
Adding
Any result from a query is presented in a table that comes with a standard set of columns and if you need to see more information, you can simply add a new column to the table.
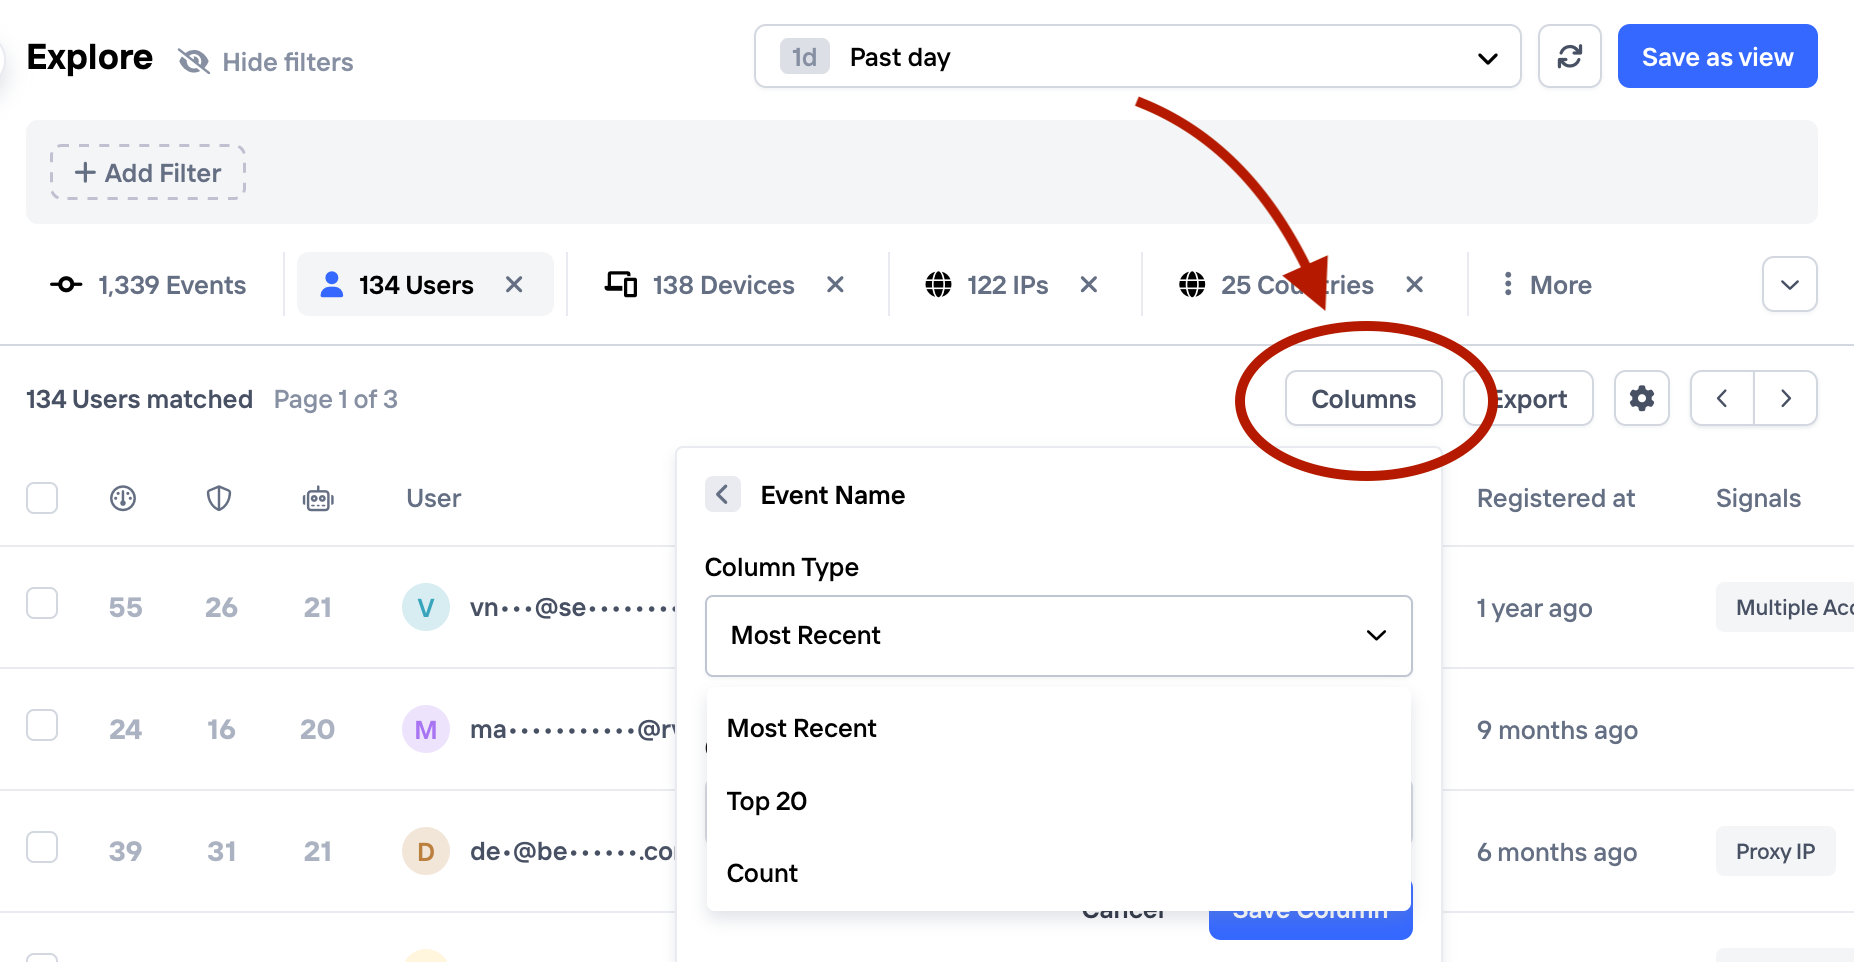
You can add columns to any results table
Since the group views are based on aggregated data, besides from the event field, you have to pick the desired aggregation function when adding a new column. The available options are:
- Most Recent. Displays the most recent value, based on the event timestamp. For example, the most recent country code for a user
- Top 20. Displays up to 20 of the most frequently occurring values. For example, the most common country codes for a user.
- Count. Displays the count of unique values. For example, the number of unique countries a user has been to.
To remove the column, simply click the column header and click "Remove Column"
Sorting
The "Events" is sorted by event timestamp by default, and this is not possible to change. However, any table in a group tab can be sorted freely by clicking the column header:
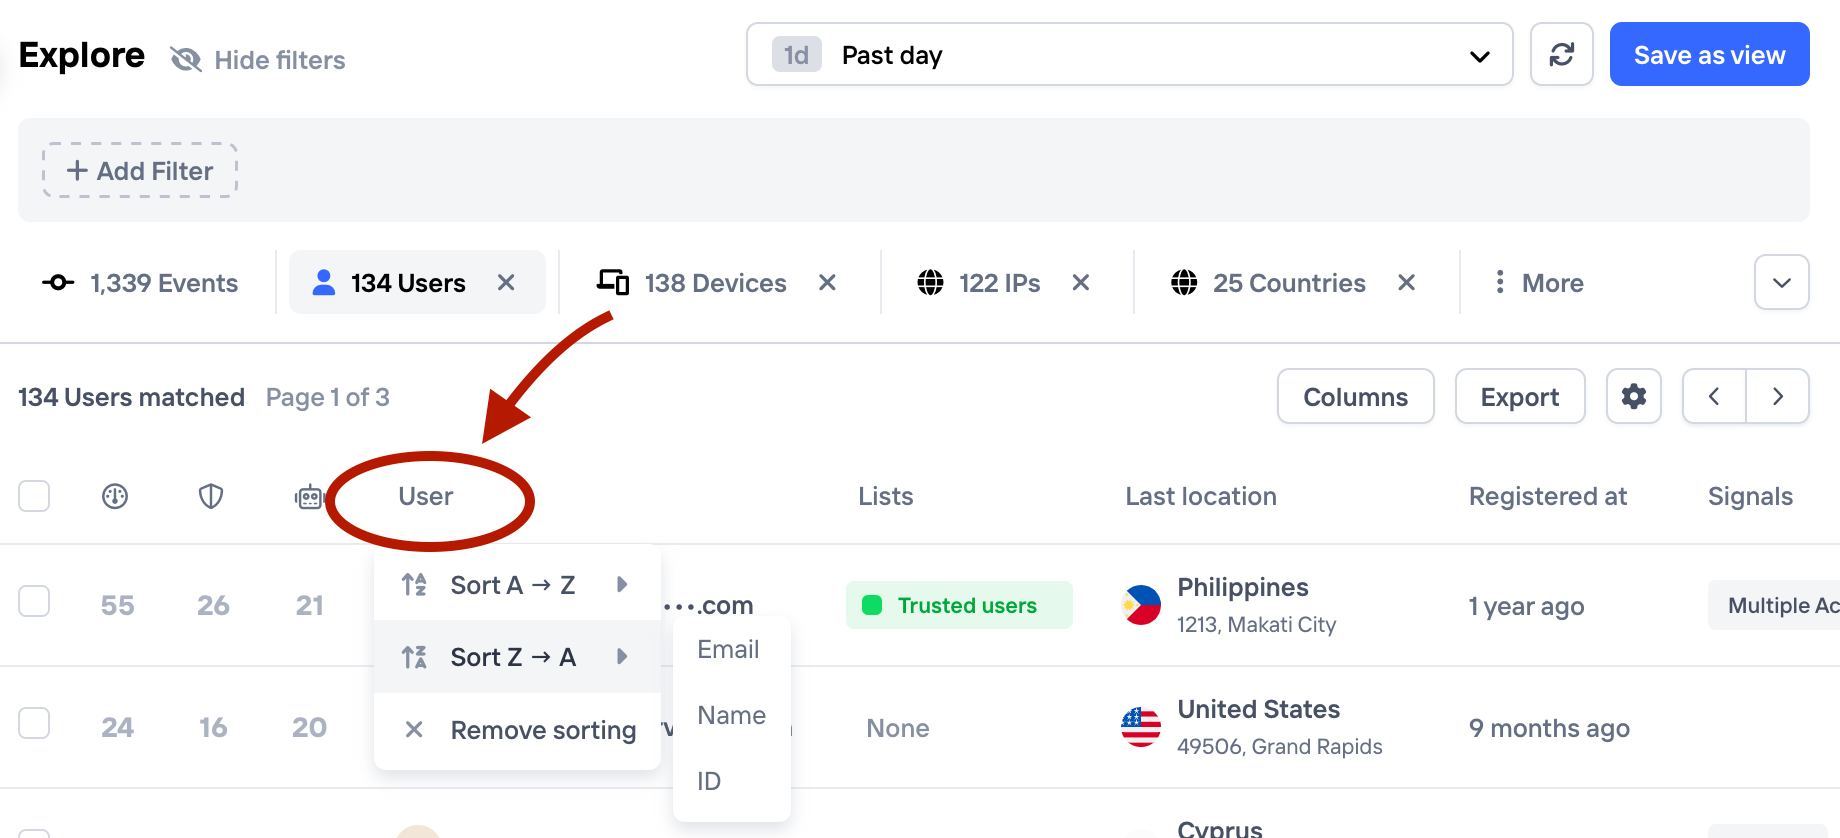
Sorting options are available in group tables, and appears by clicking on the column header
Depending on the column type, options will be presented to sort the column alphabetically or numerically, or in a way that makes sense for the value type
Views
Views is a way of persisting your filters + table and visualization settings into a screen that you can come back to quickly. For example, you can use a view in your daily routine to inspect risky transactions or users, with group, column and visualization settings that are perfectly tuned for making a quick assessment.
Adding a view
Starting with the Explore view, once you have a configuration that you're happy with, just hit the "Save as View" button in the top right corner.
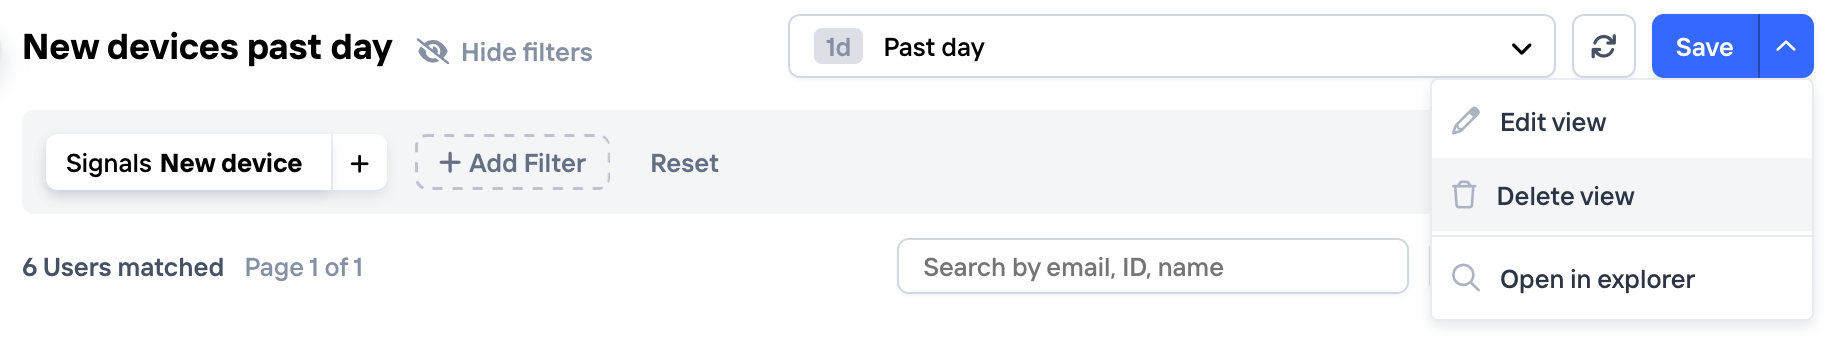
Updating or deleting a view
To update the name and description of a view, or to delete it, 1) navigate to the view by clicking on it in the side bar, then 2) click the arrow button next to the "save" button.
Creating a policy
If you've found a pattern while exploring data that you'd like to take action on, such as a set of suspicious IPs, you can save this as a policy directly from the Explore view. You'll be taken to the Policy section of the Dashboard to fill out the final details of the policy, but all the filter settings will remain, so that you can quickly go from investigation to taking action
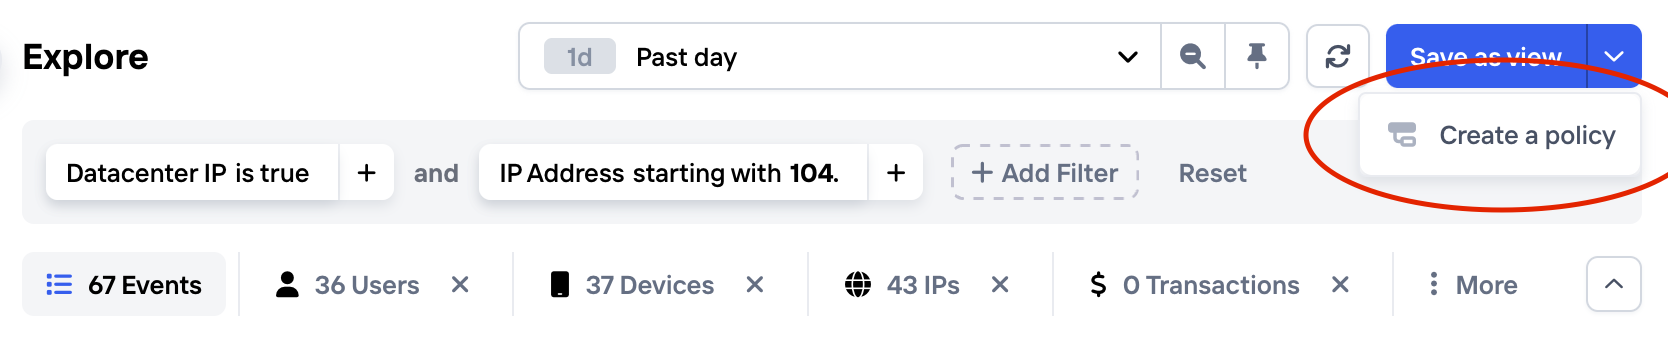
Save as Policy from the Explore view
Updated 8 months ago